What’s Happening? There is a rumour going around that CCI no longer cares about temperature and humidity specifications! That there’s no need to worry about those impossible standards! Well, the truth is that our approach has changed, but the issue has not gone away.
Conservation research scientists at CCI have shifted from defining a single, simplistic standard to identifying degrees of correctness or, more precisely, degrees of incorrectness. We try to estimate the benefit of basic control of the environment and the benefit of increasing sophistication. The following article summarizes CCI’s current approach to temperature and relative humidity.
Temperature Many artifacts will tolerate extreme cold (-30°C). Low winter temperatures indoors can reduce such problems as chemical self-destruction, pests, mould, energy consumption, and condensation in walls. At the other extreme, many artifacts will also tolerate brief excursions to 50°C. Aside from this general tolerance, three forms of incorrect temperature can be identified for a museum: temperatures that are too low, temperatures that are too high, and temperature fluctuations. Temperatures that are too low are a problem for plastics and paints because these materials become brittle at low temperatures. Acrylic paints, for example, are quite leathery and robust at temperatures that are comfortable for humans, but turn glassy and increasingly brittle below 5°C. All paintings and coatings may crack at Canadian winter temperatures (below 5°C) either simply by contraction or by accidental blows to the paint. Temperatures that are too high are incorrect for materials that self-destruct chemically within a human lifetime, such as acidic paper, nitrate and acetate films, celluloid, and rubber objects. The only practical solution for large quantities of these items is cold storage. Each 5°C drop will roughly double the lifetime of such materials, e.g., they will last a millennium at 0°C instead of a few decades at 25°C. Temperatures that are too high are also a problem for those artifacts that contain waxes or resins that soften above 30°C, such as lined paintings or artifacts that contain pitch. Temperature fluctuations can be incorrect for artifacts that contain restrained brittle layers (e.g., enamels). Generally, however, temperature fluctuations by themselves rarely cause problems.
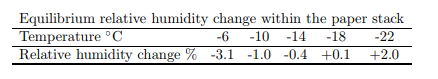
Relative Humidity The single magic number of 50% RH which was advocated in the past, works for many artifacts but not for many others. The fluctuation specification of ±3% RH, although initially seen as simply cautious and conservative, turned out to be virtually impossible to achieve in the real world. Three decades of museum experience led to the same questions over and over again: Why these numbers? How important are deviations, given the difficulties involved? In our experience, real examples of incorrect relative humidity in museums fall into one of four categories: damp, above or below a critical humidity, any humidity over 0%, and humidity fluctuations. Each incorrect RH applies to certain artifacts, and each causes very different rates of deterioration. Instead of stipulating one all-purpose and impossible “correct” humidity, CCI scientists outline the various incorrect humidities and emphasize the benefits of each level of control achieved. Overall, it is a return to the common-sense notion of avoiding extremes, augmented (rather than dominated) by scientific knowledge of more subtle effects. Damp causes mould and rapid corrosion. Numerically, “damp” begins at 75% RH, but more important is the recognition that danger grows rapidly for every step beyond this point: 80% RH is much more incorrect than 75% RH, 85% RH is much more incorrect than 80% RH, and so on to 100% RH. For example, at room temperature, the time a museum can take to correct loss of control before mould appears on the most susceptible artifacts drops from about two months at 75% RH to about two days at 90% RH. Clearly, this influences not just building design but how museum staff must respond to humidity readings. Relative humidities above or below a critical RH affects minerals that hydrate, dehydrate, or deliquesce at a particular RH. Besides natural history collections, this applies to contaminated metal objects (particularly marine or archaeological artifacts) and to some types of glass. Although damp may appear to be simply a type of “above a critical RH,” in practical terms damp is so much faster and generic in its attack that it must be considered on its own. In contrast, susceptible minerals and contaminated metals are very specific in their critical RH values. Museum control depends on special data, special containers, and special rooms. In fact, this particular form of incorrect RH has been recognized and acted on for almost a century in archaeological metal collections. Any RH above 0% is incorrect for artifacts that chemically self-destruct in a human lifetime via some process that requires moisture. The best known examples are acidic paper and acetate films. The data suggest that if the humidity were actually to reach 0% RH, then these processes would stop. However, maintaining RH below 5% year round is impractical. As shown in Table L temperature and humidity are linked on this issue. Although low temperature has the greater effect on an object’s lifetime, low RH can be achieved more easily. Individual artifacts can be sealed in inexpensive containers with desiccant. On the scale of an entire building, low RH requires far less energy or building modification, and people can work in a building with low humidity more easily than in a budding with low temperature. Also, Canadian libraries and archives can achieve mass desiccation (as compared to mass deacidification) for free during the winter by using heating systems with no humidifiers. Fluctuations in RH are incorrect for artifacts that contain restrained moisture-sensitive layers. This, of course, includes most of many museum collections. Certain artifacts, especially those that have recently been conserved, may also be very sensitive or vulnerable to RH fluctuations and may require special protection. Within the context of an overall preservation plan, however, it must be admitted that such damage can be repaired (at a cost), unlike the damage from such agents of deterioration as direct physical forces, fire, water, theft, pests, some contaminants, fading due to light, extreme damp, and chemical selfdestruction. Humidity fluctuations large enough to cause noticeable fractures in a single cycle can be considered “critical fluctuations”. Fatigue mechanics shows that fluctuations that are below a critical level will only damage artifacts in very tiny increments. Keeping the straw off the camel’s back has the most benefit! In complex assemblies like furniture or paintings, each sub-assembly has its own critical fluctuation. Therefore, the issue becomes how to know all the critical values. The simplest approach is to review local history: What is the greatest fluctuation that lasted long enough for the whole collection to have responded? This is the collection’s “proofed” fluctuation. In most Canadian museums, it is fair to estimate this as at least ±25% RH fluctuation from the local annual average. Thus, fluctuations smaller than this can only cause very slow cumulative damage. Another approach to determining critical fluctuations is to do analyses. Currently, research on paintings and wood suggest critical fluctuations for most artifacts begin at ±25% RH. Histories of artifact damage also suggest that fluctuations must reach beyond ±25% RH to cause sudden noticeable damage. History further demonstrates that many humidity-responsive assemblies tolerate extreme fluctuations of ±40% RH without noticeable damage if they are free to move. Finally, no discussion of environmental control makes sense without reference to reliability. It is far more beneficial in the long run to build practical, fixable, forgiving systems that control the worst forms of incorrect humidity than it is to build elaborate building systems that control all forms of incorrect humidity for a few years and then fail (often creating worse conditions than those they replaced).
Conclusion Has CCI radically changed environmental recommendations? No. A glance at Table I shows that institutions with the resources to give the best possible care to paint and wood have only a slightly wider permissible range of fluctuations (up to ±10% W than they did before. Fortunately, CCI’s experience shows that this range is reasonable for good mechanical systems or for RH-controlled cases. The biggest change is the recognition that the large expenditures of resources necessary to achieve ±5% RH control as opposed to ±20% RH control bring modest benefits to humidity-related deterioration. These new environmental guidelines allow museums room for negotiating the difficulties of tight budgets, historic buildings, and essential humidity requirements.
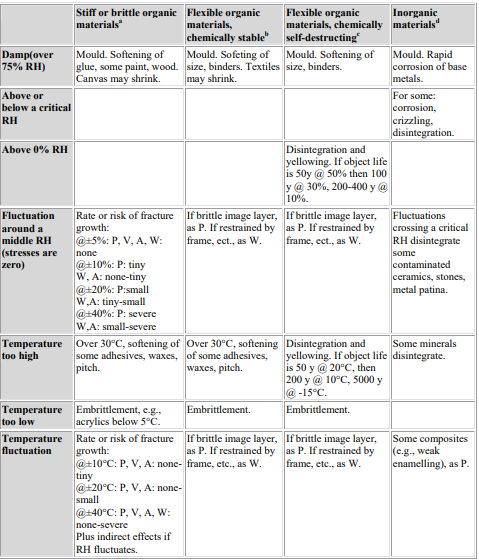
Further Reading Stefan Michalski, “Relative Humidity: A Discussion of Correct/Incorrect Values,” ICOM-CC 10th Meeting, Washington, D.C., (ICOM-CC: Paris, 1993), pp. 624-629. Table 1 Effect of Incorrect RH and Incorrect Temperature on Museum Materials
a. For example, wood (W), oil and tempera paintings and polychrome (P), varnish (V), acrylic paintings (A). b. For example, non-acidic paper and textiles, parchment, stable B & W photographs. c. For example, acidic paper, acetate films, colour photographs. d. For example, metals, minerals, ceramics, glass.
Abstract: Film in sealed metal cans is vulnerable to condensation damage during cooling for storage. Film in cardboard boxes is vulnerable to condensation damage during warming for showing. For several hours there is a temperature difference between the film and the inner surface of the container, so water evaporates from one surface and condenses on the other. Condensation can be prevented by slow cooling and warming, so that there is never more than six degrees temperature variation within the container. A modified film container, with crinkled paper leaves between the metal can and the film, should prevent condensation during rapid temperature change.
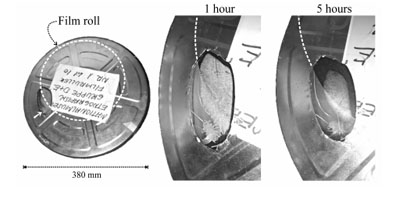
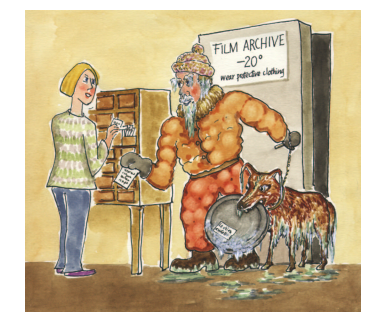
1. Introduction Much research has concentrated on demonstrating the safety of storing film cold but the brief periods of cooling and warming the film have not received so much attention. received so much attention. The danger of condensation on the outside of cold film containers immediately after removal from the cold store is well known, because it is so obvious (figure 1). The condensation that occurs within the container during both the cooling and the warming process is not visible and is more dangerous, because it occurs close to the film.
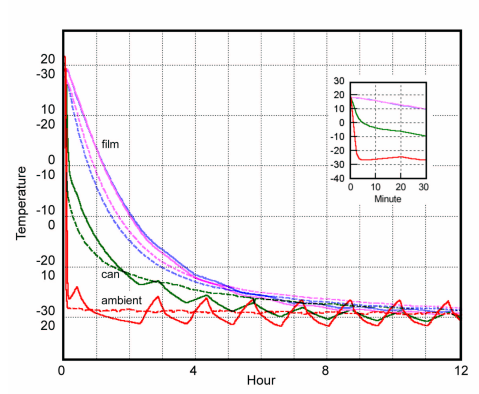
2. The cause of condensation When a film can containing a tightly rolled film is plunged into a cold room the metal can cools to the ambient temperature within a minute or two. The film roll is insulated from the cold can by a tiny air gap, formed by the ribbed structure of the can, by the tiny irregularities between turns of the film and by the loose fit of the roll in the can. It will cool down more slowly, as shown in figure 3. There is relatively little variation in temperature within the film roll, because it has quite a high thermal conductivity, so the entire roll cools down uniformly. During this period of an hour or two, the cold inner surface of the can will condense water from the air. At the beginning of the process the air will be at, say, 50% relative humidity and at 20◦C. Water vapour will condense as soon as the metal can surface falls to 9 ◦C. This temperature is called the dew point. The relationship between dew point, relative humidity and temperature is explained diagrammatically later. There is hardly any water vapour in the air gap but as soon as water vapour is removed from the air it is replenished by evaporation from the warm film, which has a considerable reserve of water absorbed within the gelatin layer, and to a lesser extent in the cellulose acetate base. There is therefore a continuous transfer of water from the film to the surface of the can. The water will condense first as water, then as ice, and the process will continue as long as there is about a ten degree temperature difference between the can and the film roll. This period can be several hours, depending on the exact situation of the film can in the cold store.
Figure 1. “We must find a better retrieval system, Dogma can’t smell the labels in the cold”.
The amount of water transferred cannot easily be calculated, because the
water absorbed at the exposed edge of the thin gelatin layer is quickly released. Thereafter the process is increasingly inhibited by the slow diffusion
of water from the interior of the roll.
Does this process matter or is it just a theoretical threat? It is easy to
find out.
3. An experimental demonstration of condensation A roll of film was fitted with tiny thermocouples and put in a metal can with a thermocouple attached to its inner surface. The can was put in a chest freezer and its progress towards the freezer temperature was followed. The thermocouples were type K with wires 0.2 mm thick. The alloys of this thermocouple type have rather low thermal conductivity, which makes them suitable for measuring steep temperature gradients where heat conductivity through the wires to the measuring tip is a source of error. Furthermore the last two centimetres of the wires were placed parallel to the surface of the film to further reduce errors due to heat conduction. One thermocouple was inserted 80 mm from the outer edge of the 260 mm diameter film roll and midway through the 35 mm thickness of the roll. This thermocouple represents the temperature of the bulk of the film roll. A second thermocouple was inserted 4 mm from the circumference and 2 mm from the face of the roll. This gives an approximate temperature for the coolest part of the film roll. The temperature of the inside surface of the steel film can was measured by a thermocouple placed flat against the surface with its last 10 mm sprung against the metal, with no adhesive to disturb the thermal gradient. The air temperature just outside the film can was measured by a fourth thermocouple. The film roll was considerably smaller than the can, which was 380 mm diameter. The roll was jammed against the edge of the can by two 120 mm rolls of film so that the thermocouple on the inner surface of the can was close to, but not touching the film. The relative humidity (RH) in the can was not measured. In my experience it is very difficult to measure RH with useful accuracy within a temperature gradient and at temperatures varying over a forty degree range. The film had been preconditioned for several years at 50% RH and 20◦C. I used data from Adelstein and co-workers [Adelstein 1997] that shows the equilibrium RH around roll film falling from 50% at room temperature to about 40% at −20◦C. The RH at any point can be calculated by assuming that the water vapour distribution within the container is uniform at all times, because the air space is so small that rapid vapour diffusion will ensure homogeneity. The RH at any point within the can is defined by the temperature and RH at the surface of the film roll, modified by the temperature at that particular point. This rather obscure reasoning is clarified with examples later. The film can was fitted with a window of 1 mm polycarbonate so that the formation of condensate could be observed when the can was immersed in the cold air in a chest freezer. The arrangement is shown at the left of figure 2. The position of the film within the can is shown by the broken white circle. The arrow beside the window points to a subtle detail of the experimental arrangement: before the lid was put on a single fingerprint was applied to the inside of the polycarbonate window from a not recently washed finger. The film can was put in a domestic chest freezer. The course of the cooling is shown with solid lines in figure 3. The two highest lines are the temperatures within the film. These lines are so close together that one can assume that the thermal conductivity within the mass of film is high compared with the thermal conductivity of the still boundary layer of air at the surface of the film roll. The film can be considered uniform in temperature, with the entire temperature gradient confined to the narrow air spaces between the roll of film and the metal container. After one day the film can was removed from the freezer and allowed to warm up unprotected. The course of the warming is shown as broken lines in figure 3. These lines are inverted, with a corresponding inverted scale on the axis, so that warming is represented by a falling line. This rather confusing trick is to show that the course of warming is not much different from the cooling pattern. The initially steeper rate of warming is due to the heat released by the abundant condensation of ice on the outside of the can immediately after removal to the warm room air. The slower rate that sets in after about thirty minutes can be attributed at first to the melting of the ice and later to the slow evaporation of the melt water. Both of these processes absorb heat and slow the progress to room temperature. These are minor complications in a pattern that shows the essential symmetry of the cooling and warming processes.
Figure 2. Condensation inside a metal film can is visible through a small polycarbonate window. The entire can is shown on the left. The broken white circle marks the circumference of the film roll within. The arrow points to a fingerprint on the inside of the window. The middle picture shows the situation after one hour in a cold box at −25◦C. There is ice on the window opposite the film roll and on the fingerprint, which is slightly hygroscopic because of salts from sweat. On the right is the situation after five hours. The ice is evaporating and the water vapour is being re-absorbed into the film. The process is not so fast where there is no film close by to absorb the water vapour, as shown by the persistent ice on the fingerprint.
4. Interpretation of the data and observations At the beginning of the cooling process, the air close to the surface of the film will have a moisture content which depends on that of the film. The film was equilibrated to 50% relative humidity (RH). If we suppose that the film is at 20◦C one can read from the standard psychrometric chart, or Mollier diagram, that the air at the surface will contain 8.6 g/m3 of water, equivalent to a water vapour partial pressure of 1167 Pascal. An approximation to the psychrometric chart is shown in figure 4. I will use vapour pressure units in the rest of the discussion. The water vapour concentration is proportional to the water vapour partial pressure. One must not imagine that the water vapour is exerting a pressure in the everyday sense: all water movement is by diffusion or by flow of the water molecules entrained in a convective air stream. The temperature at the inside surface of the metal drops quite quickly to −5 ◦C. It shares the same air space as the film, so the water vapour concentration should be the same at its surface as at the film surface, because water vapour molecules diffuse rather quickly through the confined space. But that water vapour concentration is not possible, because the maximum possible concentration in air at −5 ◦C is 3.4 g/m3 (400 Pa). The excess water vapour will condense as ice on the metal surface. Figure 2, centre, shows ice deposition on the inside of the polycarbonate window. The presence of ice signals that the relative humidity at that surface is 100%.
Figure 3. The rate of cooling and subsequent warming of the film can. The continuous lines show the course of the cooling process. The broken lines show the warming process when the can is lifted out of the cold box. These warming lines are inverted to allow direct comparison with the cooling curves. These values should be read against the inverted scale on the vertical axis. Notice that the temperature at the edge of the roll is not much different from the temperature deep in the mass of the roll. The can cools very quickly, as shown in the inset with stretched time axis. The slowly cooling mass of the film creates a temperature gradient confined to the air space between film and can. This causes efficient transfer of water from the film to the inner surface of the container.
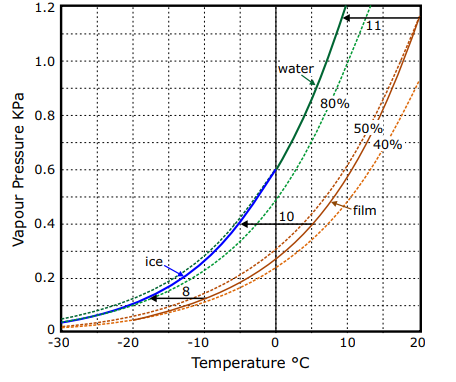
If we now turn our attention back to the film, which is still only a degree or so below 20◦C, the RH of the air at its surface should have dropped, to about 20%. The film can is acting as a dehumidifier – withdrawing water vapour from the air and locking it up as ice. The surprisingly low RH calculated for the surface of the film is a consequence of the steep rise in the saturation partial vapour pressure of water vapour as the temperature increases towards the surface of the film. The RH is the ratio of the actual vapour pressure, 400 Pa, to the saturation partial pressure at the surface of the film, which at 18◦C, is 2054 Pa. This low RH is far from equilibrium with the water content of the film, which has hardly changed from its starting value, because there is a lot of water in the film, compared to the relatively small amount of ice that has formed, while the water content of the small volume of air in the can is negligible in comparison to both. The film will therefore release water vapour into the air at its surface, to restore the RH to nearly 50%. This air will then diffuse away to the surface of the can, depositing more ice. This distillation process will continue as long as the equilibrium water vapour concentration at the surface of the cooling film is greater than the maximum possible vapour concentration at the surface of the can. This limit can easily be calculated, or read from figure 4. The equilibrium RH at the surface of the roll of film will fall as it cools, from 50% at 20◦C to a little under 40% at −25◦C. This is plotted as the lower solid curve in figure 4. We now search for the point on this curve where the water vapour pressure is the same as that at the surface of the ice. Since the water vapour concentration is assumed to be uniform everywhere in the enclosure we need only draw a horizontal line from the point defining the vapour pressure over ice at −25◦C (64 Pa) to the curve defining the vapour pressure over the surface of the film. The point of intersection is at −17◦C, with the film at about 38% RH The movement of water vapour from the surface of the film to condense first as water, then as ice on the inner surface of the can will therefore continue from soon after the film can is put in the cold chamber until the film has cooled to −17◦C. One can put the matter in another way: if the temperature difference between film and can exceeds about 10 degrees at any time, there will be condensation. This temperature difference for causing condensation applies approximately at all temperatures between 20◦C and −30◦C. Figure 4 shows the nearly parallel trajectories of the vapour pressure curve for water and ice (the higher solid line) and the vapour pressure at the surface of film that has been equilibrated to 50% RH at room temperature. The horizontal arrows show the course of the cooling process for the air diffusing from the warm film at three points in the cooling process. The lines are horizontal because the air has a constant water content, meeting no source, or absorber of water on its journey. Where these lines hit the saturation vapour pressure line, condensation will occur. The lines vary from 11 degrees long at room temperature to 8 degrees long at −10◦C. The smaller temperature difference required for condensation at the lower temperature is due to the lower saturation vapour pressure over ice compared to water at the same temperature. This is a minor detail. The point is that if the temperature difference between can and film is never greater than about six degrees, there is no risk of condensation. This rule of thumb applies to film at equilibrium with 50% RH. Moister film will cause condensation at a smaller temperature difference. In very moist film, ice will even form within the film on cooling. The 80% RH line intersects the vapour pressure curve over ice at about −20◦C. This means that moist film at equilibrium with over 80% RH at room temperature will form ice crystals within itself on cooling below −20◦C. This divergence in the vapour pressure over ice and over supercooled water looks unimportant on the graph but indicates a considerable danger during the later stages of the cooling process.
Figure 4. The variation with temperature of the saturation water vapour pressure over water and ice (upper solid curve) and the actual, unsaturated vapour pressure over film conditioned to 50% RH at room temperature (lower solid curve).The broken lines show the vapour pressures corresponding to 80%, 50% and 40% RH, based on the vapour pressure over water, supercooled below zero degrees. The vertical vapour pressure scale is also a concentration scale, so that as air diffuses from the surface of the film towards the cooler can it follows a horizontal path on the diagram, because it cannot obtain, or release water vapour during the journey across the gap. Where this horizontal line hits the saturation curve, condensation will occur. Three horizontal lines show that for film pre-equilibrated to about 50% RH at room temperature the can must be 11 degrees cooler than the film for condensation to occur. At lower temperatures the temperature difference required for condensation is slightly smaller, but a six degree difference in temperature should always be safe for film conditioned to a moderate RH. The vapour pressure curve for ice slides downwards to cut the 80% RH curve at about −20◦C. This means that film at equilibrium with this high RH will suffer damage from ice crystallisation.
Once the can of film has attained temperature uniformity, the water in the ice that is formed on the inside surface of the can is reabsorbed into the film. The RH over the ice surface is by definition 100% and the film will assert a RH close to its surface of about 40%, depending slightly on how much water it has lost to the ice deposit. Since the temperature of ice and film are now the same, it is the relative humidity gradient that defines the water vapour concentration gradient, which is now in the opposite direction. The water will therefore diffuse back into the film. The disappearance of the ice after just a few hours is shown on the right in figure 2. The formation of ice is therefore a transient phenomenon which causes no damage to the film, as long as the ice and the film are separated by air. In practice, however, the geometry of the system is more complicated: at some points the film will touch the metal, keeping it warmer. At these points the water vapour may condense as water for a considerable period, and be absorbed by capillarity into the turns of the film roll, causing local wetting. Later in the process this water will freeze within the film, with consequent physical damage through the growth of ice crystals. One might ask why the ice, as it evaporates from the can, does not reform as ice at other places within the film. Maybe it does, sometimes. This experiment is not nearly detailed enough to test the theory but in principle it is possible to generate ice crystals within the film roll. Suppose that the film roll is not uniformly wound, so that there are small gaps, like slightly parted lips, between the turns of the roll. Here the water vapour has easy access, so the local RH can approach 100% though it will never quite reach that value. But even 80% RH will cause ice crystals to form within the film, as described above. There is even a small chance that ice will form in the extreme outer surface of the film roll, where the edge of the gelatin is exposed. I have heard no reports of fraying of the edge through repeated freeze-thaw cycles, but I’m not sure that anyone has looked. In the end, however, as the film comes to equilibrium throughout its mass, ice will disappear. This is because the water in the film, now in equilibrium with 40% RH, is not in a form that can crystallise as ice. Ice forms when water molecules take up a certain orientation to each other to form the solid lattice. Water molecules in the film are individually bound to atoms in stiff polymer molecules. They are believed to jump frequently between absorption sites but they do not clump together and reorient themselves to form ice crystals, because this process requires more energy than the absorption of separated water molecules on the polymer chains.
5. Does this condensation matter? At this point the reader will be thinking that this is just another academic exercise without any significance in practice. No-one has reported damage from rapid cooling of film, so why worry? My point is that the damage will not be of the sort that is easily noticed. Condensation in film stores, as in buildings, causes damage precisely where there is inhomogeneity in the structure. That is why I added the fingerprint: even handling the film, or the can, with sticky fingers can provoke accumulation of considerable amounts of water concentrated in one area. The salts in sweat not only absorb water from the air but also reduce the freezing point of the solution below zero. Condensation as ice on the can is usually harmless, and the theoretical risk of ice formation within the film during the last stages of cooling is not proven, but water can condense if parts of the can are cool but above zero degrees for some time; for example, where several cans are put together into the cold room, or where the contact with the warm film is fairly close, as described above. One can imagine that the experiments of scientists testing the damage done by exposure to cold will miss examples of local damage, precisely because they are so careful to make a perfect experimental setup. In any case such damage will only be visible as blemishes that flash by too quickly to be properly seen when the film is projected, or copied
6. How can condensation be prevented? Condensation on cooling can be prevented by making the film container of a moisture absorbent material such as cardboard. This will absorb the water vapour from the warm film, so that the RH at the cold surface never reaches 100%. Unfortunately, this solution just pushes the moment of danger over to the warming up process. The warm, moisture absorbent box will then take over the role of the film in the previous scenario: releasing water vapour to maintain 50% RH in the warm air at its surface. This moisture will then condense on the cold roll of film, first as ice on the surface, which later melts and runs into the capillaries of the film roll. This is a much more devastating process, all the more efficient because cardboard releases water vapour much more readily than the tightly wound film, where water vapour only exchanges through the thin strip of gelatin exposed at the edge of the film. Thermally insulating boxes are not a reliable solution. The inside surface of the box will be warmer, but the time this surface is above zero degrees will be longer, with a consequent risk of water condensing and moving into the film. However, a can in which the gap between itself and the film is filled with an absorbent material which is also insulating, should entirely stop condensation. This is because the amount of water transferred from the film to the can is very much reduced if convective streaming of the air is prevented. The space could be filled with leaves of crimped paper which provide a softly elastic gap filling substance which still has tiny air pockets to provide thermal insulation. The paper will slow down the diffusion of water vapour both directly, by preventing convective streaming, and by itself absorbing water to buffer the transfer process. The dramatic improvement that can be expected from such a change in film containment is suggested by a second experiment.
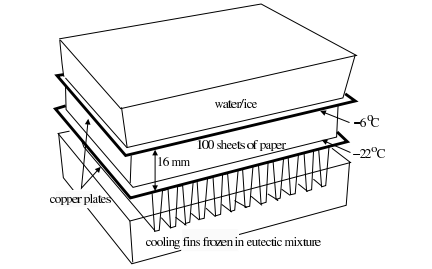
7. Water transfer through paper subjected to a temperature gradient The inhibiting effect of layers of absorbent material on vapour transfer was demonstrated with the experiment shown in figure 5. A stack of sheets of paper was placed between two copper plates at different temperatures and the moisture movement was followed by weighing the paper sheets. nd the moisture movement was followed by weighing the paper sheets. The thermal mass of the warm film roll is here represented by a substantial water container, initially at 20◦C, but cooling fairly rapidly to zero degrees. The temperature then remained at zero for the rest of the experiment, due to the slow freezing of the water. The water container rested on a copper plate which settled to a steady -6◦C. Directly under the plate is a sheet of paper, which, like film, contains substantial water content in equilibrium with 50% RH, its initial state. This sheet represents the exposed edge of the film, with its exchangeable water in the gelatin layer. Between this sheet of paper and a second copper plate held at about -22◦C were a further approximately 100 sheets of paper, with a total thickness of 16 mm. Thermocouples were distributed equally through this mass of paper, and also some sheets were treated with dry methylene blue powder to detect the presence of water during cooling, or during subsequent warming to room temperature (the grey methylene blue particles dissolve to give an intense blue stain). The entire assembly was lowered into a chest freezer where the lower copper plate rested on an aluminium finned heat sink frozen into a eutectic mixture of 55% polyethylene glycol in water, which has a melting temperature at about -18◦C. In fact, the heat flow through the paper was too small to cause the heat sink to reach this temperature. After 24 hours of exposure to this constant 16 degree temperature gradient, there would have been condensation on the lower copper plate if there were just air between it and the one layer of paper stuck to the upper plate. With the stack of paper in place there was no reaction from the methylene blue condensation detector. Selected pieces of paper were removed from five positions within the stack, put into sealed polyethylene bags, warmed and weighed in the bags. The weight loss in the uppermost piece of paper was equivalent to a fall in equilibrium relative humidity around it of just 3%. Correspondingly the lowest piece of paper, in contact with the lower copper plate, had gained water equivalent to a 2% rise in RH in the air within it. There was therefore no danger of condensation on the colder plate, representing the film can. The reduction in water vapour transport through the paper stack can be regarded as analagous to the reduction in heat transfer through an insulating layer. The vapour must move by diffusion across the tiny air spaces, a process that is much slower than convective flow. The experimental setup was thicker than is practical in a film can, for experimental convenience and precision. However, one would expect that a much thinner paper stack would provide sufficient protection to cooling film
Figure 5. Experiment to measure water vapour diffusion through layers of paper between two surfaces at different temperatures. The tray at the bottom is filled with a eutectic mixture of polyethylene glycol in water. A finned aluminium heat sink is immersed in this frozen mixture at about -25◦C. A copper plate, 25 cm square is placed on the heat sink. 100 sheets of paper are piled on this plate. Five groups of five sheets each were weighed before the experiment began. These groups are distributed evenly throughout the pile, with thermocouples to measure the temperature at the same points. This pile of paper sheets is surrounded by a guard ring of paper sheets, to ensure a uniform temperature and moisture gradient perpendicular to the copper plates. Single sheets of paper dusted with methylene blue dye are inserted just below the weighed sheets to test for liquid water during cooling or after warming. The warm side of the assembly is provided by a polyethylene box nearly filled with water, which sits on the top copper plate. The dimensions and quantities are such that the freezing water in the box keeps it at zero degrees for two days, after a short initial cooling from room temperature. The entire assembly was set in a chest freezer. After 24 hours the weighed pieces of paper were removed, sealed in plastic bags in the cold, and then warmed up before reweighing.
8. Discussion of the alternative solutions The extraordinary effectiveness of an absorbent, porous interlayer which entirely fills the gap between the warm and the cold surfaces, suggests that a minor change to film can design would allow film to be tossed into the cold store with no intermediate conditioning at all. Removal from the cold store could also be brutally quick, without any danger. One must appreciate that this system works because there is no air space big enough to allow convective flow of air, and there is no space big enough that there can develop a more than 10 degree temperature gradient across it. A simple wrapping of the film in tissue paper before putting it into the can is not enough, and can cause serious condensation, because of the very easily exchanged water content of the paper and the uncontrolled geometry of the air spaces. The absorptive, reasonably insulating lining must be both uniform and springy so that it embraces the film roll without significant air pockets Until such a containment system is developed and tested, the reliable solution is to slow down both the cooling and the warming processes, so that there is never more than six degrees temperature variation anywhere in the mass of materials. It is not so easy to establish rules for the safe handling of batches of materials that can vary from a single negative to a wagon load of multi-reel movies. I suggest that the clumsiest but probably the most reliable method is to move all material through a conditioning lock, where all materials, regardless of bulk, are slowly cooled or warmed at a pace that is safe for the most massive conceivable package This advice only applies to film that is in equilibrium with less than 60% RH. If the film has a high water content, the cooling has to be done even more slowly. Film that one suspects is over about 80% RH equilibrium should not be put into the cold store. It will suffer damage even if it is cooled and warmed very slowly. The danger is not averted by slow cooling: at this water content ice crystals will form within the gelatin layer. Such film should first be dried to about 50% RH at room temperature. The next question is: how does one measure the equilibrium RH around a roll of film that has just been shipped in from being copied or shown? A simple but adequate way is to put the film in a fairly well fitting polyethylene bag together with a paper relative humidity sensor of the dial type, with a display bold enough to be read through the plastic. An electronic RH sensor can also be used and will respond quicker. The sensor should be close to the flat side of the film roll. After an hour at a constant room temperature the reading of the sensor should be reasonably stable and sufficiently accurate, though not quite at its final equilibrium. Take care that there is not a strong light on the bag, because this can cause temperature gradients that disturb the moisture equilibrium Both paper and electronic humidity sensors are notoriously unstable and need calibrating about every six months. If all this seems rather tedious one can draw the conclusion that film should hardly ever be moved in and out of cold storage: a program of copying for showing will reduce the strain on both film and archivist.
9. Acknowledgements Karen Brynjolf Pedersen prepared the experiment with the paper moisture buffer and Yvonne Shashoua photographed the ice growing within the can.
10. Reference Adelstein,P.Z., Bigourdan,J.-L., Reilly,J.M., 1997. Moisture relationships of photographic film, Journal of the American Institute for Conservation, Volume 36, Number 3, 193 – 206 Conservation Department, The National Museum of Denmark, Brede, DK2800 Kgs.Lyngby, Denmark. E-mail address: tim@padfield.dk
Introduction
Museums are faced with the challenge of preserving artifacts for the enjoyment and education of current and future
generations. The wide variety of artifacts that museums display requires maintaining specific environmental
conditions to minimize their deterioration. Proper relative humidity (RH) control is one of the most important
environmental factors in artifact preservation.
Conservation research has shown that RH levels above 65% will promote microbial growth (primarily fungi), while
RH levels below 25% can lead to brittleness and cracking. In addition, large fluctuations in RH can lead to
dimensional changes, deformation, and mechanical stress in organic materials. Though there is still debate about the
appropriate RH requirements for museum environments, a set point of 50% (or the historic building average) with
allowable fluctuations of ±5-10% is a generally accepted guideline.
Though mechanical humidification systems for RH control are common, many museums do not use them due to
factors such as cost and the difficulty integrating them with the existing building structure and aesthetics. An
alternate method of RH control that is employed in many museums is the use of an adsorbent material in
combination with a well-sealed display case to create a micro-environment that serves to mitigate the large RH
fluctuations that the general building environment may experience.
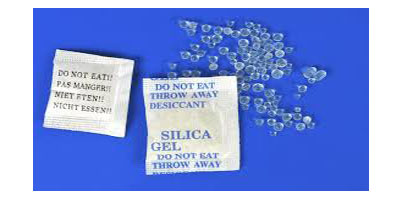
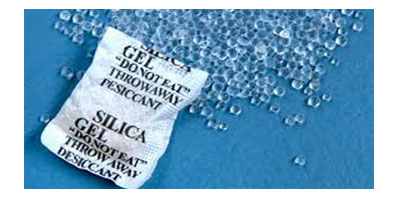
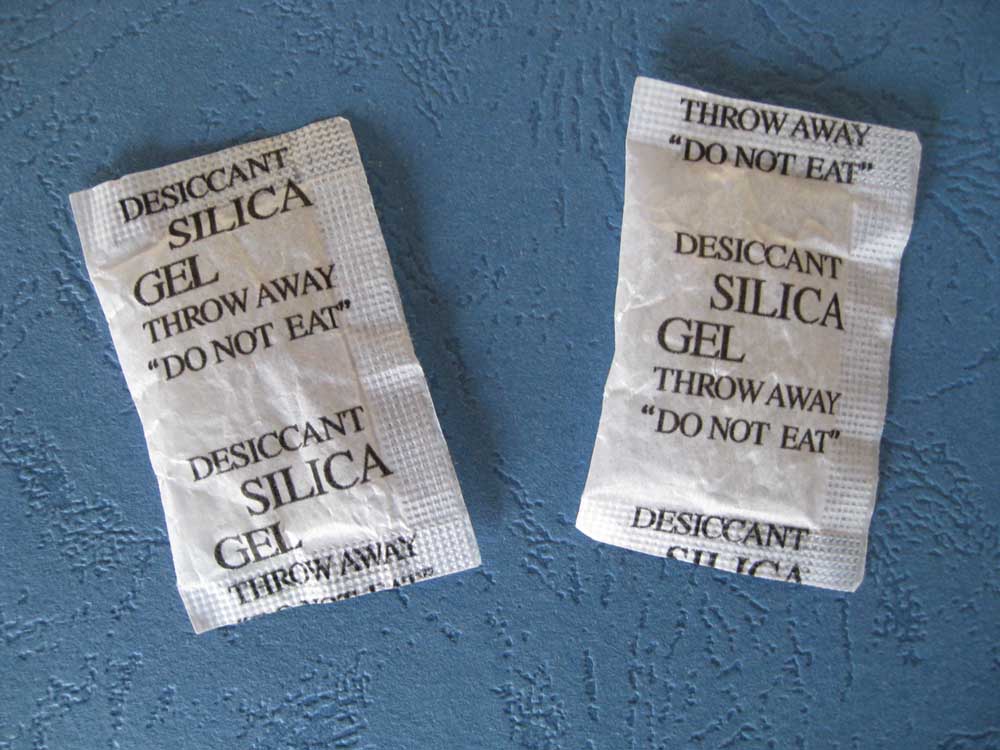
The most commonly used adsorbent is silica gel due to its high water capacity, chemical inertness, and ability to
undergo an indefinite number of moisture cycles. This method has been prescribed in the conservation literature for
many years, most notably by Thomson (1977) who developed the idea of ‘hygrometric half-time,’ t1/2, as the time it
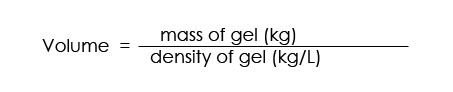
takes for the RH inside a case to reach the halfway point of the ambient RH. The hygrometric half time is calculated
by the following equation:
Thomson calls M the ‘specific moisture reservoir’ of the buffering material. M is defined as the mass of water (grams
of water) gained or lost per unit mass of adsorbent media (one kilogram of buffering material) for a 1% change in
RH. The M-value is essentially the slope of the buffering material’s adsorption isotherm evaluated at a specific RH,
and it describes the incremental moisture buffering capacity of a material. In order to provide effective RH control,
the adsorbent material must have a high M-value over the acceptable RH range for a given artifact. Increasing the Mfile:///
C|/Documents%20and%20Settings/Owner/My%20Documents/websites/museumClimateControls/SGelCases.htm (1 of 18)12/11/2007 11:43:48 AM
An Evaluation of Silica Gel for Humidity Control in Display Cases
value reduces the amount of adsorbent required to achieve proper control.
According to Thomson, the hygrometric half time is dependent upon two main factors: (1) the air leakage rate of the
case, N and (2) the amount of the buffering material inside the case, B. B will be referred to as the gel sizing factor; it
is the dry mass of buffering material in kg per cubic meter of case volume. By decreasing the air leakage rate or
increasing the amount of buffering material, the hygrometric half time is increased, and greater RH control inside the
case can be achieved.
Thomson states that a well-sealed case can be expected to have an air leakage rate of one air change per day. Using
Eq.1 Thomson calculates that 20 kg/m3 (1.25 lb/ft3) of silica gel with an M-value of 2 g/kg would be needed to
achieve a hygrometric half-time of 150 days for a display case having a leakage rate of 1 air change per day (ACD).
This recommendation has become the standard guideline for using silica gel as a passive RH control method inside
display cases.
Previous studies, e.g., Guinchen and Gai (1984), Schweizer (1984), Stolow (1977), have found silica gel to be an
effective method of RH control inside display cases. However, in a recent research project evaluating the
environmental conditions at the Field Museum of Natural History in Chicago a silica gel application was found to be
ineffective at controlling the RH inside a newly-constructed display case.
The case had a volume of 1.7 m3 (60 ft3) and contained Chinese wood and ivory carvings. Three cassettes, each
containing 750 grams (1.65 lbs) of Art-Sorb, were located in drawers at the bottom of the case. The Art-Sorb was
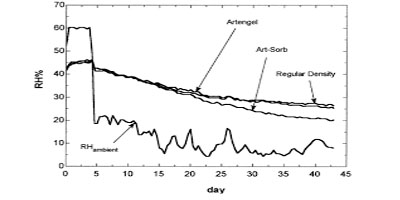
conditioned to a relative humidity of 45% prior to being placed inside the case. Figure 1 shows the relative humidity
levels measured inside and outside the case over a two-month period from February to April of 1999. The Art-Sorb
had no discernible buffering effect with the relative humidity levels inside the case being almost the same as the
ambient levels and well below the desired level of 45%.
Figure 1. Comparison of RH levels inside a display case containing Art-Sorb with ambient building levels at the
Field Museum of Natural History in Chicago, Illinois.
file:///C|/Documents%20and%20Settings/Owner/My%20Documents/websites/museumClimateControls/SGelCases.htm (2 of 18)12/11/2007 11:43:48 AM
An Evaluation of Silica Gel for Humidity Control in Display Cases
This experience became a motivating factor for the present study. The goal of this study was to evaluate the
effectiveness of silica gel for use in controlling RH levels inside display cases. The study consisted of the following
parts:
m experimentally determine the adsorption and desorption isotherms of the three silica gels
m develop a mathematical model of the solid adsorbent media for passive RH control in a display case
application
m experimentally validate the model
m use computer simulations to evaluate the effect of varying building and case conditions on silica gel
performance.
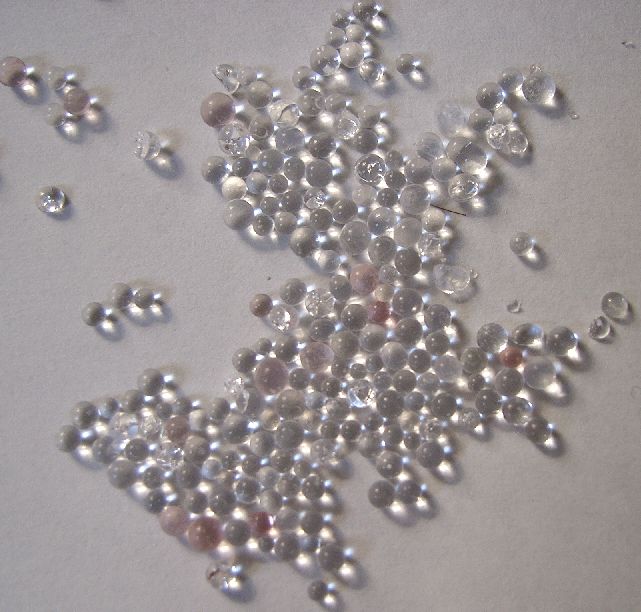
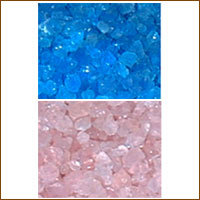
Three silica gels were evaluated in the study. They were generic regular density silica gel, which is available from
many chemical supply companies, and two specialty gels marketed specifically for museum conservation
applications: Artengel and Art-Sorb.
Experimental Measurement of Adsorption and Desorption Isotherms
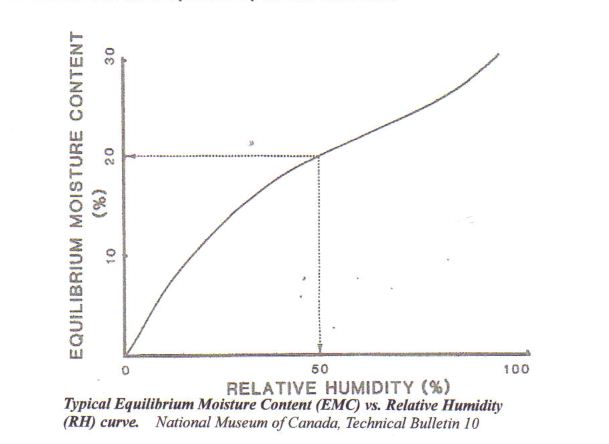
The adsorption and desorption isotherms describe the equilibrium moisture concentration (EMC) of a material at
different RH levels.
The isotherms of the three gels were measured experimentally by allowing samples to come into equilibrium at
different RH levels inside a constructed humidity chamber and measuring their weight gain in water. Equilibrium
was attained when the measured weight of the gel samples did not change over time.
Table 1. Equilibrium relative humidity values at
25°C. for salt solutions used in isotherm
experiments from Greenspan (1977).
Salt Equilibrium RH % at 25
C
Lithium Chloride 11
Magnesium
Chloride
33
Potassium
Carbonate
43
Sodium Bromide 58
Sodium Chloride 75
The isotherms were measured three times to verify their accuracy. Weight measurements were made with a Sartorius
L420 S top-loading laboratory scale (accuracy ±0.0005 g) which was located in the humidity chamber. Different RH
levels were achieved using the saturated salt solutions listed in Table 1, the work of Greenspan (1977).
file:///C|/Documents%20and%20Settings/Owner/My%20Documents/websites/museumClimateControls/SGelCases.htm (3 of 18)12/11/2007 11:43:48 AM
An Evaluation of Silica Gel for Humidity Control in Display Cases
The RH inside the chamber was measured using a Hobo H8 Pro Series Temp/RH data-logging sensor with a stated
manufacturer’s accuracy of ±3% RH and ±0.3°C. An isotherm set was also measured using a high accuracy General
Eastern Hygro M-1 dew point hygrometer (accuracy ±0.2°C).
Experimental Isotherm Data
Table 2 shows the experimental adsorption and desorption isotherm data for the three gels. All the data were
obtained at temperatures between 23-25°C. The EMC of each gel is expressed as a percentage of the gel’s dry
weight, so an EMC of 20% means that the gel would be able to hold an amount of water equal to 20% of its dry
weight.
Adsorption Isotherm
RH % Equilibrium Moisture Concentration(%)
Regular
Density
Artengel Art-Sorb
11 9 8 8
11 9 9 9
11 7 7 8
33 19 17 14
33 20 19 16
33 19 18 15
44 24 23 18
44 25 24 19
44 26 25 19
60 31 35 25
60 32 35 27
63 32 37 31
74 34 43 53
74 34 43 54
100 37 48 95
file:///C|/Documents%20and%20Settings/Owner/My%20Documents/websites/museumClimateControls/SGelCases.htm (4 of 18)12/11/2007 11:43:48 AM
An Evaluation of Silica Gel for Humidity Control in Display Cases
100 37 48 100
100 37 47 109
Desorption Isotherm
RH % Equilibrium Moisture Concentration (%)
Regular
Density
Artengel Art-Sorb
11 9 9 10
11 8 8 8
11 9 8 9
34 24 20 15
34 24 20 17
34 25 21 17
46 31 33 21
46 31 34 20
46 31 35 22
62 33 41 31
62 33 41 34
65 33 41 39
74 34 43 66
74 34 44 66
The experimental isotherm data were fitted to the Dubinin-Astakhov (D-A) (1977) equation using a non-linear least
squares method. The D-A equation expresses the equilibrium moisture concentration of the gel as a function of the
adsorption potential, A defined as:
The Dubinin-Astakhov equation is given by:
EMC%=q x 100 (Eq. 4)
where q0, q1, E0, E1, n1, and n2 are equation parameters.
file:///C|/Documents%20and%20Settings/Owner/My%20Documents/websites/museumClimateControls/SGelCases.htm (5 of 18)12/11/2007 11:43:48 AM
An Evaluation of Silica Gel for Humidity Control in Display Cases
Figures 2-4 compare the isotherm’s curve fits from the Dubinin-Astakhov equation with the experimental data for
regular density silica gel, Artengel, and Art-Sorb, respectively. All three gels show some hysteresis with the
desorption isotherm lying above the adsorption isotherm. Art-Sorb has the least amount of hysteresis with most of it
occurring above 60%. Regular density silica gel’s hysteresis occurs below 60%, while Artengel’s occurs in the 30-
70% range.
Figure 2. Regular density silica gel.
file:///C|/Documents%20and%20Settings/Owner/My%20Documents/websites/museumClimateControls/SGelCases.htm (6 of 18)12/11/2007 11:43:48 AM
An Evaluation of Silica Gel for Humidity Control in Display Cases
Figure 3. Artengel
file:///C|/Documents%20and%20Settings/Owner/My%20Documents/websites/museumClimateControls/SGelCases.htm (7 of 18)12/11/2007 11:43:48 AM
An Evaluation of Silica Gel for Humidity Control in Display Cases
Figure 4. Art-Sorb
Gel Comparison
In comparing the gel isotherms, it is best to focus on the 30-60% RH range since that is the desirable range for
museum environments. Figure 5 shows the EMC of the three gels in the 30-60% RH range. In this range, Art-Sorb
has a lower moisture capacity than Artengel and regular density silica gel, which have similar capacities.
file:///C|/Documents%20and%20Settings/Owner/My%20Documents/websites/museumClimateControls/SGelCases.htm (8 of 18)12/11/2007 11:43:48 AM
An Evaluation of Silica Gel for Humidity Control in Display Cases
Figure 5. Equilibrium moisture capacity of three gels in the relative humidity range of 30-60%.
In evaluating the buffering performance of the three gels, it is more appropriate to use the change in moisture
capacity over a given RH range, represented by the M-value, rather than the specific moisture capacity at a specific
RH as shown on the isotherm plots. Over a given RH range, a gel with a linear isotherm will have a constant Mvalue
and thus a constant performance, while a gel with a non-linear isotherm will have a varying M-value and thus
its performance will vary with RH. Since the M-value is essentially the slope of the isotherm at a given RH, it can be
calculated for each of the three gels by taking the derivative of the D-A equation. Figure 6 compares the M-values
for the three gels based upon their adsorption isotherms over the 30-60% RH range. Artengel has a fairly constant Mvalue
of 7 g/kg. The M-value for Art-Sorb increases with RH from 3 to 10 g/kg, while regular density’s M-value
decreases with RH from 6 to 3 g/kg.
file:///C|/Documents%20and%20Settings/Owner/My%20Documents/websites/museumClimateControls/SGelCases.htm (9 of 18)12/11/2007 11:43:48 AM
An Evaluation of Silica Gel for Humidity Control in Display Cases
Figure 6. Comparison of M-values for the three adsorbants in the 30-60% RH range.
Based upon these results, Artengel would be expected to have a consistent performance over the 30-60% RH range.
Art-Sorb’s performance would be better in the higher RH range, while regular density’s performance would be better
in the lower RH range.
Using eq. 1, Thomson’s original calculations were revisited using the present results to determine the amount of each
gel required to achieve a case half-time of 150 days with a case leakage rate of 1 ACD. Table 3 lists these results
along with the calculated cost of each gel per unit of case volume.
Table 3. Comparison of calculated gel sizing factors and costs
using Thompson’s equation to achieve a case half-time of 150
days with a case leakage rate of 1 ACD.
Gel Gel Mvalue
@
45%
RH
Gel
Sizing
Factor
(kg gel/
m3 of
case)
Gel
Cost ($/
kg of
gel)
Gel
Cost ($/
m3 of
case)
Regular density 4.5 7 16 110
ArtengelTM 7 4.6 22 100
file:///C|/Documents%20and%20Settings/Owner/My%20Documents/websites/museumClimateControls/SGelCases.htm (10 of 18)12/11/2007 11:43:48 AM
An Evaluation of Silica Gel for Humidity Control in Display Cases
Art-Sorb TM
(study data)
3 10 40 400
Art-Sorb TM
(company data)
4.7 6.5 40 260
The results presented in Table 3 are based upon each gel’s M-value at 45% RH (the middle of the 30-60% range). Art-
Sorb’s M-value was calculated using both the measured isotherm data and the data listed in the company’s literature.
Regular density silica gel costs are calculated from the stated bulk price from a common manufacturer. The costs for
Artengel and Art-Sorb are based upon each company’s stated price for bead type media.
Since Artengel has the highest M-value of 7 g/kg, it has the smallest sizing factor of 5 kg/m3. Art-Sorb and regular
density silica gel have about the same M-value around 5g/kg and thus have similar sizing factors of around 7 kg/m3.
On a cost basis, Artengel and regular density have nearly the same unit cost (i.e. cost per unit of case volume), while
Art-Sorb has more than double the cost of regular density silica gel.
Case Model
In order to evaluate the long-term performance of the three gels under varying conditions, a computer model was
developed. The following assumptions were used in the modeling of silica gel behavior inside of a display case:
m Case material and artifact have negligible water buffering capacity i.e. the buffering material preferentially
adsorbs and desorbs moisture.
m No spatial variation of RH inside the display case.
m Dry bulb temperature inside the case microenvironment is the same as the building macroenvironment.
m Temperature of the buffering media is the same as the dry bulb temperature in the case microenvironment.
The two water exchange processes included in the model are: (1) the exchange of water vapor between the case
microenvironment and ambient building macroenvironment air due to infiltration and (2) the exchange of water
vapor between the gel and case air. The rate of water exchange due to infiltration is expressed by:
Because the movement of air inside a well-sealed display case is dominated by free convection, intra-particle
resistance is assumed to be negligible and the transport of water vapor from the bulk case air to the gel surface is
assumed to be the dominant resistance to mass transfer. From the work of Kafui (1994), the rate of mass transfer
from the case air to the gel surface can be described by a lumped external mass transfer coefficient, Kgel, with the
change in water concentration of the adsorbent media with time being expressed by:
A water balance that includes these two water exchange processes can be written
file:///C|/Documents%20and%20Settings/Owner/My%20Documents/websites/museumClimateControls/SGelCases.htm (11 of 18)12/11/2007 11:43:48 AM
An Evaluation of Silica Gel for Humidity Control in Display Cases
where mH2O is the mass of water in the case at time t and mH2O,0 is the initial mass of water. Knowing mH2O, the
relative humidity can be calculated as a function of time using psychrometric relations.
Model Validation
The validity of the model was determined by comparing model predictions with the results of a long-term experiment
that measured the RH inside three moisture-impervious containers, each with a volume of 3.79 liters.
Each container held a 10-gram sample of one of the three gels which was initially conditioned to an RH of 43%. A
30-mm hole located in the top of each container allowed each container to have a similar leakage rate. The RH inside
the containers and the ambient room value was measured using a Hobo H8 Pro Series Temp/RH sensor. The longterm
experiments involved monitoring the RH for a period spanning 42 days.
Figure 7 compares the model predictions with the long-term experimental data for regular density silica gel. Figure 8
compares the performance of the three gels for the long-term experiment. Regular density silica gel and Artengel
perform almost identically with a final RH of 26%, while Art-Sorb is less effective with a final RH of 20%. For all
three gels, the model prediction is within the ±3% accuracy of the measured data.
Figure 7. Comparison of model prediction with experiment data for regular density silica gel.
file:///C|/Documents%20and%20Settings/Owner/My%20Documents/websites/museumClimateControls/SGelCases.htm (12 of 18)12/11/2007 11:43:48 AM
An Evaluation of Silica Gel for Humidity Control in Display Cases
Figure 8. Comparison of gel performance for long-term experiment.
Simulation of Silica Gel Performance
Using the model, simulations were run to evaluate the performance of the three gels inside display cases under
varying building and case conditions. Three different ambient building RH profiles representing a dry, humid, and
moderate building environments were used to drive the model. A dry building environment was simulated by using
RH measurements taken over a one-year period at the Field Museum of Natural History. The 7-month heating season
from October to April results in an average annual building RH of 35% with the RH dropping below 40% for 60% of
the year. A humid building environment was simulated by inverting the Field Museum data to create an average
annual building RH of 55%. A moderate building environment was represented by a sine wave with an average RH
of 45% and an amplitude of 15%.
The three variables analyzed with the model were the case leakage rate, amount of gel inside the case, and the type of
gel. For Art-Sorb, simulations were run using both the company’s adsorption isotherm data and the isotherm
determined from the current study’s experiments. Table 4 lists the parameters and values that were used in the
simulations.
Case model simulation parameters and values.
Simulation Parameter Values Used in Simulations
file:///C|/Documents%20and%20Settings/Owner/My%20Documents/websites/museumClimateControls/SGelCases.htm (13 of 18)12/11/2007 11:43:48 AM
An Evaluation of Silica Gel for Humidity Control in Display Cases
Gel Sizing Factor (kg/m) 5, 10, 15, 20, 30, 50
Case Leakage Rate (ACD) 0.25, 0.5, 1, 2,5
Case RH set point 45%
Initial Gel RH Building
Environment
45%
dry, humid, moderate
Simulation Results
Figures 9-11 compare the simulation results for the dry, humid, and moderate building RH environments,
respectively. The Y-axis on each plot is the maximum predicted RH fluctuation inside a case over a one-year
simulation. The X-axis is the amount of gel inside the case per unit of case volume in the units of kg/m3. The
different lines on each graph represent the performance of the gel at a specific case leakage rate value, N, in units of
air changes per day. For example, looking at the Artengel plot in Fig. 9, a case with a leakage rate of 2 ACD (n=2)
and containing 20 kg/m3 of gel would undergo an RH fluctuation of 8% from the desired set point of 45% over an
entire year in a dry building environment.
For all three building environments, Artengel has the best performance yielding smaller case RH fluctuations than
the other two gels for a given case leakage rate and gel sizing factor. Since it has a constant M-value over the 30-
60% RH range, Artengel’s performance is not affected by different building environments. Since its M-value
increases with RH, Art-Sorb performs better in a humid building than a dry one. In contrast, regular density silica gel
performs better in a dry building than a humid one because its M-value is highest in the lower RH range.
There is little difference in the predicted performance of Art-Sorb using either the company or current study’s
isotherm data. The amount of gel required to keep the RH fluctuation to an acceptable level increases as the case
leakage rate increases. If the maximum desired case RH fluctuation over a one-year period is 10%, then a case
leakage rate of 2 ACD or less is necessary. Higher case leakage rates would require more than 30 kg/m3 of gel which
would likely be impractical and costly. Within the case leakage range of 0.25-2 ACD, between 5-30 kg/m3 of silica
gel would be required for adequate control over a one-year period.
Figure 9.Maximum predicted case RH fluctuations over one-year simulation for three silica gels in a dry
buildingenvironment for different case leakage rates (N) and gel sizing factors
file:///C|/Documents%20and%20Settings/Owner/My%20Documents/websites/museumClimateControls/SGelCases.htm (14 of 18)12/11/2007 11:43:48 AM
An Evaluation of Silica Gel for Humidity Control in Display Cases
Figure 10.As above, for humid buildingenvironment
file:///C|/Documents%20and%20Settings/Owner/My%20Documents/websites/museumClimateControls/SGelCases.htm (15 of 18)12/11/2007 11:43:48 AM
An Evaluation of Silica Gel for Humidity Control in Display Cases
Figure 11.As above, for moderate buildingenvironment
file:///C|/Documents%20and%20Settings/Owner/My%20Documents/websites/museumClimateControls/SGelCases.htm (16 of 18)12/11/2007 11:43:48 AM
An Evaluation of Silica Gel for Humidity Control in Display Cases
Conclusions
Based upon the experimental and computer simulation results of this study, the following conclusions can be made:
m All three gels would provide effective RH control using Thomson’s recommendation of 20 kg/m3 if the case
leakage rate is 1 ACD or less.
m On a pound for pound basis, Artengel has a higher buffering capacity than either regular density silica gel or
Art-Sorb.
m On a cost basis, regular density silica gel and Artengel have about the same cost for a given amount of
buffering capacity while Art-Sorb has twice the cost.
m Over the RH range of 30-60%, Artengel has a consistent performance, while Art-Sorb performs better above
50% and regular density silica gel performs better below 40%.
m For the conditions investigated, a case with a leakage rate of greater than 2 ACD would require more than 30
kg/m3 of gel in order to keep the display case RH fluctuation at 10% or below over a one year period.
m For the conditions investigated, a case with a leakage rate of 2 ACD or less would require 5-30 kg/m3 of gel
to keep display case RH fluctuations to 10% or less over a one year period.
References
ASHRAE, Applications Handbook, American Society of Heating, Refrigerating, and Air Conditioning Engineers,
Atlanta, GA (1999).
Ault, J., S.A. Klein, D.T. Reindl, J. Guay, “Indoor Environmental Control: Review of Current Recommendations and
Survey of Conditions at the Chicago Field Museum,” accepted for ASHRAE Transactions, March, 2001.
CCI (1984). Technical Bulletin 10: Silica Gel. CCI. Ottawa, Canada.
Dubinin, M., “Physical Adsorption of Gases and Vapors in Micropores,” Prog. Surf. Membrane Science, 9, pp. 1-70,
(1975).
Erhardt, D. and Mecklenburg, M., “Relative Humidity Re-examined,” Preventive Conservation: Practice, Theory and
Research, ed. by A. Roy and P. Smith. London, IIC, pp. 32-38, (1994).
Greenspan, L., “Humidity Fixed Points of Binary Saturated Aqueous Solutions,” Journal of Research of the National
Bureau of Standards – A. Physics and Chemistry, Vol. 81A, No. 1, Jan-Feb, (1977).
Guinchen, G., and Gai, V., “Controle du climate autour de 197 instruments de musique,” 7th Triennial Meeting,
ICOM Committee for Conservation, Copenhagen, 84.17.19-84.17.25, (1984).
Kafui, K.D., “Transient Heat and Moisture Transfer in Thin Silica Gel Beds,” Transactions of the ASME, Vol. 116,
pp. 946-953, Nov., (1994).
Polanyi, M., “Theory of Adsorption of Gases. A General Survey and some Additional Remarks,” Trans. Far. Soc.,
Vol. 28, 316-333, (1932).
file:///C|/Documents%20and%20Settings/Owner/My%20Documents/websites/museumClimateControls/SGelCases.htm (17 of 18)12/11/2007 11:43:48 AM
An Evaluation of Silica Gel for Humidity Control in Display Cases
Schweizer, F., “Stabilization of RH in Exhibition Cases: An Experimental Approach,” 7th Triennial Meeting, ICOM
Committee for Conservation, Copenhagen, 84.17.50-84.17.53, (1984).
Stolow, Nathan, “The Microclimate: A Localized Solution,” Museum News, Vol. 56(2): pp. 52-63, (1977).
Thomson, G., “Stabilization of RH in Exhibition Cases: Hygrometric Half-time,” Studies in Conservation, Vol. 22,
pp. 85-102, (1977).
[Search all CoOL documents]
[Feedback]
This page last changed: September 09, 2003
file://
Abstract For all our concern about the damage caused to art by the environment, there are no data which allow us to connect measured environmental variables with the rate of deterioration of the art in exhibition or storage. Recent proposals for rating the suitability of spaces and the vulnerability of individual objects require a durability of electronic data which is very unlikely to be achieved. This is a review of the state of the art of recording the environment around art.
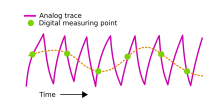
Figure 1: The human readability of analog records produced by thermohygrographs gives many advantages. For quality control, rather than research, the thermohygrograph still has a role to play in museums.
Introduction Climate records are evidence of care. The thermohygrograph ticking quietly in the corner of an exhibition announces the professional standard of the institution even if its ink line wanders shakily up and down on the graph. The ritual aura of the thermohygrograph, with its public display of the room climate and its evidence of a human visit once a week, has now been lost as this long lived instrument has nearly universally been replaced by digital sensors. The loss is more serious than the disappearance of a comfortingly familiar gallery exhibit. The digital records are vulnerable to erasure. They are doomed to loss by format obsolescence unless converted into a durable standard format. The digital storage media are of uncertain physical durability. One cannot assume that digital recorders are more accurate than the thermohygrograph. PADFIELD — CLIMATE RECORDS
Figure 2: The Image Permanence Institute has developed a data logging and reporting system which measures temperature and relative humidity, from which it derives a preservation index in expected years of life for an object in that environment. The indicated lifetime is rather pessimistic.
The need for durable records There are several recent initiatives in preventive conservation which require environmental records for individual objects or exhibition rooms stretching back, ideally to the birth of the object. The first of these data hungry proposals is the call to limit exposure of light sensitive objects to a lifetime dose. This is based on the good evidence that photochemical damage accumulates according to the total photon dose rather than the light intensity in photons per second. A dim light will eventually cause the same damage as a bright light will cause quickly. Light intensity in an exhibition varies much from place to place, and from time to time if there is daylight. One would have permanently to fix a photon counter to every object, maybe on several surfaces. This can be done, in the same way security tags are fixed to items in shops. However, what is the chance that the communication and storage format for these devices will not change in the thousand years that is the conservator’s perspective in matters of durability? The blue wool standards remain the most durable device to measure accumulating light exposure. The second example of the need for durable records is the Image Permanence Institute’s (IPI) Preservation Environment Monitor and Climate Notebook [1,2]. The hardware provides a readout of the Time Weighted Preservation Index (TWPI), which is an arcane measure of the rate of damage predicted from the temperature and relative humidity recorded since the logger was switched on. This number, though expressed as years of useful life for the object, is not based on the nature of the object but on its environment, so only one logger is needed per room. The calculation is presented every few seconds but only gives a true indication of the quality of the environment on the anniversaries of its first PADFIELD — CLIMATE RECORDS
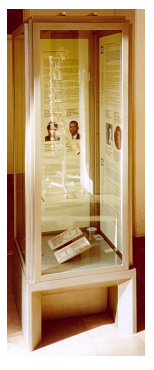
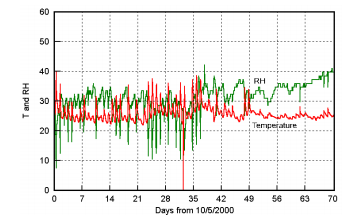
Figure 3: A carved ivory tusk from Africa, almost invisible in the glare of the sunlight warming its showcase. The room temperature and RH were acceptable but a datalogger within the case registered an extreme local climate (figure 4)
measurement. This is because the annual climate cycle has a strong influence on the number, unless the room is air conditioned, in which case the TWPI will be constant and needs only a single reading. The TWPI for a comfortably warm room predicts a lifetime for its contents around 50 years, but for an open sided barn in northern Europe it is 150 years. So there should not be much old stuff left indoors. The fact that most things do actually survive much longer seems not to have dented trust in the TWPI. There is, however, a fundamental insecurity in relying on idiosyncratic derived values rather than fundamental and durable physical measures such as temperature and relative humidity. The third example of the need for durability in climate data is the concept of ‘proofed climate variation’, as currently championed by Stefan Michalski. Once something is broken by extreme relative humidity or temperature it will survive unscathed any number of smaller fluctuations without any more damage, unless its vulnerability is reset by conservation treatment. The problem with using this assertion is the scant information about the circumstances which caused the damage we now can see in an object. We need the climate record right back to the birth of the object, and we need to be sure that the object has not been temporarily exposed without recording its local climate. In practice, one would usually use the annual variation of climate in its present location. In other words, there is no point in improving the climatic stability of a museum which has had its collection for a year or two. This is a great relief to the management but though proofed variation is an elegantly simple concept it applies only to mechanical damage: mould, salt efflorescence and metal corrosion will continue if the climate moves into the region of vulnerability, even though a more extreme condition has arisen earlier.
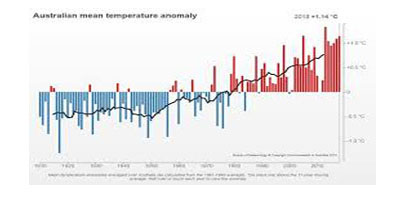
The fourth example of the need for durable data is to demonstrate the effect of global warming on heritage items. There seem to be scant usable data from past measurements, so we must start now to define the ‘normal’ climate of a historic building, against which to judge future threats, and maintain well calibrated records for a hundred years. For this purpose we need measurements both inside and outside the museum or historic monument. For lack of these data the English National Trust is reduced to quoting crumbling sea cliffs and flooded lawns as anecdotal evidence for its need for more money to combat the effects of global warming.
Figure 4: The climate measured inside the case shown in figure 3. The datalogger, set in the relative cool of the base of the case, was ivory coloured to ensure that it experienced the same radiant heating as the object. At day 38 the case was moved into the shade.
The first three examples ideally need dataloggers strapped to the individual items. The fourth requires measurement of the weather also. Apart from the environmental data, one needs an equally meticulous record of the travels of the object from room to room, noting periods out of range of its usual datalogger. I illustrate the adventures that may occur out of sight of the data collection system with an example from the routine operation of an un-named institution, from which I have recently retired. It lends out its treasures, guarded by a loan contract which specifies close limits to display temperature. When the items are returned they are promptly plunged into a cool chamber at –30◦C to snuff out insects which may be hitching a ride into the store room. By some contortion of reasoning, an extreme temperature deliberately imposed in a good cause does not risk damage that is feared to arise from a much smaller temperature excursion caused by mere carelessness. Note that this treatment will earn good points from the IPI logger, which will award the cooled object an extra lifetime varying from decades to a single day, according to how long before this event the logger was switched on. The ‘proofed climate variation’ concept will also comfort the curator by assuring that after the first cycle through the cooler, the object can be re-cooled without further damage. Truly, conservation is an irrational discipline. But let us set aside such cynical observations and continue on the assumption that environmental records are valuable and must be kept accurate, kept for ever, and ideally be readable for ever.
Figure 5: Estimation of proofed exposure to climate requires the datalogger to be always close to the object it is monitoring. This is particularly true in transport cases, where the climate recorder must be at the same temperature as the object to report true values of the RH at the object.
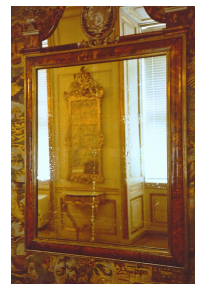
Figure 6: A silver mirror damaged by exposure to –30◦C. Physical damage is difficult to see on less optically perfect objects. The record of the appearance of an object before cooling is seldom detailed enough to convince that no change has occured.
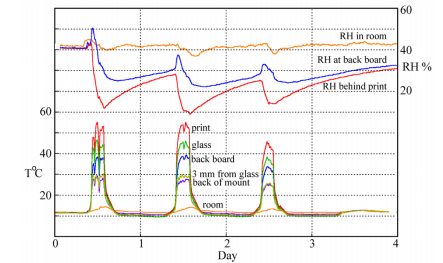
Figure 7: The temperature and RH distributions within a framed print behind glass as it was illuminated by sunlight which had already passed through a window
What and where to measure
For quality control of the museum environment it is conventional to measure only temperature and relative humidity. The most potent of all agents of destruction in a well managed museum is light. This is hardly ever measured, because it is so variable within a single enclosure. The photochemical potency of the radiation is never measured. The lux is a convenient and durable standard, being directly related to the SI unit, the candela, but it is only tenuously related, within two orders of magnitude, to the rate of photochemical degradation.[3] The air exchange rate is not measured because it is difficult to measure. Pollutants are getting easier to measure but there are not yet standard plugin sensors for dataloggers. Sensors for biological activity are also rare. So we measure two variables which, though important, are far from defining all the essential characteristics of the environment. Indoor data alone are useless for diagnosing faults in the building structure, or in the air conditioning apparatus, because the outside weather must be measured and also the rate of exchange with outside air. In theory, the outside weather can be approximated by the nearest official weather station but such data nearly always cost money. There are a few internet data banks for the world’s weather but the records are incomplete and intermittent from nearly all sources. It is time consuming to merge data from two sources, each with a different measuring interval and data format. A serious study of the microclimate in a building without air conditioning is therefore impossible with our present data stock. Every such campaign must be treated as a research project with its own data collection. Placing the sensors is not a trivial matter. Even the relatively gentle light in a museum can raise the temperature of an object two degrees, depending on its colour. This will depress the surface RH by six percent. If direct sunlight, even filtered through window glass, reaches the sensor or an object, the temperature can rise by 40◦C (figure 7), giving a huge change of local RH, depending on the buffer capacity of the enclosure. The ivory sculpture in the sun in a showcase (figure 3) was exposed to an extreme climate (figure 4) which was captured by a datalogger within the showcase, ivory coloured to give an accurate record of the suffering of the ivory object. This record could not be used to establish a ‘proofed climate extreme’ because subsequent examination revealed small clean cracks over the object together with dirt filled ancient cracks. However, the resolution of the photographic record of the object was too poor to show either type of crack.
This brings us to the one essential piece of data still missing: the evidence for change of condition of the object. This should be recorded together with the environmental record, but hardly ever is. The National Gallery, London, pioneered the real time study of colour fading. Few institutions are prepared to support such slowly unfolding projects, but many institutions are insistent on storing partial environment data that has little likelihood of providing valuable insight over the long term. There have been attempts to develop surrogate sensitive objects to set out in museum galleries, for example the tempera paint strips developed by Marianne Odlyha [4], but the rapid early changes measured in these strips seems to be a maturing process which is much faster than the rate of decay of tempera in centuries old paintings. Metal tokens are also available; their corrosion is measured by electrical resistance change or by weight change measured through vibration frequency. Such measurements are not yet commonly integrated with the collection of climate data.
Data as a series of point measurements
The thermohygrograph is an analog instrument which registers all the time, with a certain lag in response. Digital data loggers wake up at intervals to make a measurement. They can be set to measure once per hour, or once every minute, memorising the average every hour, or many other combinations of intervals. Intermittent measurement prolongs battery life but is vulnerable to a phenomenon called ‘aliasing’. This is illustrated in figure 8. It is not important in naturally ventilated rooms but can cause misinterpretation of air conditioning, which usually generates a cyclically varying climate which can interact with the measuring cycle of the logger to register a spurious beat frequency cycle.
Calibration of sensors
Calibration of temperature sensors is very rarely done because even the cheapest sensors, thermistors, have become reliable. However, the sensor signal is subjected to electronic processing that may itself be temperature sensitive. Temperature compensation is quite a subtle design challenge in electronics, which cannot be assumed for data loggers operating far from room temperature. Cheap data loggers are also sensitive to battery voltage. In reality, we have no idea of the accuracy of temperature records. he accuracy of temperature records. A year is a long time in the life of a relative humidity sensor. Most survive only until they suffer a moment of condensation. There are long lasting RH sensors but many loggers use unstable sensors. In situ calibration of both temperature and RH is best done with a psychrometer. This instrument has the advantage of depending on two temperature sensors, which are inherently reliable and whose identical readings can be checked. Furthermore, the RH signal is in the form of a temperature difference. However, its accuracy depends on how it is used. The conventional wisdom is that distilled water must be used but that is a simplified specification of the purity required. There must be no long chain alcohols or other film forming chemicals from sweat, which reduce the evaporation rate of water. These cause a greater error than using tapwater. Another largely ignored source of error is radiative heating from the body of the operator when using the sling psychrometer in a cold place. This can easily cause a five percent error in RH. This error can be avoided by using a clockwork or electrically aspirated psychrometer which has shielded temperature sensors.
Figure 9: The psychrometer is suitable for in situ calibration, if the wick is free of film forming chemicals and radiant heating of the wet sensor is prevented. There are also transportable dew point sensors, which don’t need wetting.
The other commonly used RH calibrator is a saturated salt solution, sometimes encapsulated so only water vapour passes through a semi-permeable membrane. The problem with these devices is that for calibrating at a RH point below the ambient RH, the salt solution will be absorbing water vapour and thus diluting the surface solution. Diffusion of ions to equalise the concentration is very slow in unstirred solutions, so too high a RH is generated. This calibration method only works for high RH points above ambient, where the calibrating solution is losing water vapour. One can stir the solution, but this heats it up, thus increasing the water vapour pressure at the surface and increasing the RH at the cooler surface of the sensor. Lack of temperature uniformity is a frequent cause of error when using saturated salt solutions for calibration. A one degree celsius difference in temperature between calibrating device and the datalogger causes about a 3% error in RH. Few conservation departments have constant temperature cabinets for equilibrating the sensor with its calibrating aqueous solution. Calibrating RH sensors is difficult even in the laboratory and is inaccurate when done in situ.
Figure 10: Data loggers have a valuable role to play in persuading the museum authorities not to be satisfied with bad storage rooms just because they are cheap.
Storing the data There are several specialised scientific groups which have established highly effective and durable databases. Notably x-ray diffraction patterns and infra red spectra are available in standard formats and are well maintained by central organisations. Every one of these spectra is useful – each describes a chemical compound or crystal. Climate data are much more diffuse, much less universal in their usefulness and only occasionally throw up diagnostically helpful events, or dramatic failures of environmental control. The signal to noise ratio is thus very small, so it is unlikely that an idealistic group of people will gather their energies to establish a data bank. One must assume that environmental records will be stored locally in the institution, for routine measurements. For investigative use of dataloggers, one must hope that developments in scientific digital publishing will allow verbose experimental data to be stored together with the compact, readable article, and thus be available to sceptical readers wishing to re-examine the evidence Even if data are stored in a long-lived institution, the danger to durability is the chaos of competing formats in the computing industry, whose most influential companies are mainly interested in market share tomorrow. Idealistic groups and individuals have tried to establish durable standards in their particular profession, and for general purposes, but this has only further complicated the decision on what storage format to use by widening the number of alternatives. Looking back over the mere 20 year history of widespread computing power one is struck most by our inability to direct, or even anticipate its development. The many manufacturers of small dataloggers in particular have invented their own storage formats with no thought for compatibility with other devices, or for durability Recently, the XML standard, which is a standard for defining a format, has become widely used. It makes it possible for anyone to define a standard by tagging the data values in plain text, with a corresponding explanation of what the value represents, in another document or in the heading of the file. XML has the advantage of being, in principle, readable by any program for ever, but it is verbose and scarcely humanly readable. For example, the first three lines of the following record: My kitchen hour temperature RH 10:00 18.7 56 11:00 19.3 53 12:00 20.7 50 13:00 22.0 47 are represented in a spreadsheet with XML file format by this code fragment: The “ValueType” is defined at another place in the file as 60 for text, 40 for a real number and 30 for an integer. Note that the hour-minute format has been automatically changed into a fraction of the day. Each cell is painstakingly described, even though the data is a simple repeating pattern of numbers in three columns. The whole file is about 150 lines long, because irrelevant details of the spreadsheet layout, such as the font size, are also recorded. This example comes from the ‘Gnumeric’ spreadsheet, but ‘Excel’ will also export XML in a similar but not identical format. In earlier, simpler days, it was the convention when storing naturally repetitive, columnar data that a few lines at the top of the file would describe the data layout. In this convention the data would be stored thus: #My kitchen #hour:minute temperature RH 10:00 18.7 56 11:00 19.3 53 12:00 20.7 50 13:00 22.0 47
The hash sign at the beginning of the top two lines marks a comment line, by long established convention in the unix operating system and its programs. To make this data set more specific, the date should be added. Here, the confusion becomes comic. Many dataloggers only talk to the Microsoft Excel spreadsheet. Excel supports two different start dates. The default, inherited from Lotus 123, is January 1, 1900, as day 1. However, Excel for Macintosh uses the Apple clock, which has January 1, 1904, as Day 0. The Lotus 123 date, which the tender seedling of the now dominant Excel thought it had to accept, had a wrong leap year and soon became a day wrong. The first widespread operating system, unix, settled on measuring time in seconds from January 1st 1970. ANSI dates start at 1 January 1601. There are many more date formats. Even the Julian day, used in some dataloggers, has varying definitions, but loggers never use the authoritative definition: days since noon of the first day of the year 4713 BC. You may think all this irrelevant, since the spreadsheet displays the date in calendar format, but it stores the date on file as a single decimal number.[5] The solution is to ensure that the date field in the final, durable format file has the date-time expressed in the file as a conventional calendar date in plain text, rather than a single number, as used for internal calculations in spreadsheets. However, the text calendar also has confused conventions. The first twelve days of the month are ambiguous because the US puts month before day, then year, while everyone else uses the day-month-year convention. The ISO date format solves this very neatly by using the logical sequence yearmonth-day-hour-minute-second. the ISO format for hour 16, minute 46 of the seventh of May 2007 is: 20070507T16:46:00. Dates formulated in this way sort well, and data sets can easily be merged, because the most significant unit comes first, as in normal numbers. However, nobody uses the ISO date format. Excel cannot export it, though it can read it. The unreflective decisions of individual programmers and the conservatism of users have often prevailed over the wise deliberations of expert committees.
Physical storage of climate data Even if the format is durable, the storage medium is not. Optical storage media have a predicted durability of decades, compared with hundreds of years for neutral paper. And paper’s durability is not a predicted value, it is based on experience.
Conclusions We currently store only a subset of the information needed to connect environmental influences with observed degradation of materials. Only very seldom is the measuring device sufficiently close to the object for it to constitute a definitive record for that object. The data are stored in a variety of formats with no convention about what format to use for data storage and interchange. This situation is entirely adequate to ensure quality control of the environment during exhibition and transport but it is unlikely that data will be retained long enough, and the measured variables be comprehensive enough, or close enough to the object, for scientific study of the effect of environment on materials over many years. One has to conclude that routinely collected environmental data is unlikely to yield interesting information to future enquiries.
References [1]http://www.imagepermanenceinstitute.org/ [2] The physical chemistry underpinning the preservation index is explained at: http://www.padfield.org/tim/cfys/twpi/twpi 01.php [3] http://www.padfield.org/tim/cfys/lightmtr/luxerror.php [4]M.Odlyha, N.S.Cohen and G.M.Foster “Dosimetry of paintings : determination of the degree of chemical change in museum exposed test paintings (smalt tempera) by thermal analysis” Thermochimica Acta 365 (2000)35-44. [5]http://decimaltime.hynes.net/dates.html Creative commons licence: free to use for any purpose, but the author must be acknowledged and no changes may be made.
The search for an active system commenced in February 1978, when the Royal Ontario Museum held a workshop to explore practical ways to make this happen.
The purpose of this workshop was to explore practical ways of producing micro climates for displaying museum materials which cannot withstand exposure to fluctuations of ambient gallery conditions. Existing solutions to the problems of creating and sustaining micro climates include documented pieces of research and some successful but very specialized applications. In the hope of consolidating the existing information into a more coherent whole and possibly discovering new solutions, it was decided to hold this workshop. The aim was to assemble experienced people in all of the fields involved – conservation, design, and mechanical engineering- and to analyze the present state of the art as well as determine whether there might be viable new ways to approach micro climates. All this would be discussed in the workshop in a concentrated study by a group which had experts on all facets of the problem. The emphasis was to be on the production of practical solutions, not merely the exploration of abstract ideas. The workshop explored a variety of questions throughout the three days. Most generally they focused on the following problems areas: Which artifacts do not require micro climates? Which artifacts need micro climates which can be provided using existing solutions? Which artifacts require new solutions? What are appropriate solutions to the problem of case design? Which buffers are appropriate? Which mechanical solutions are appropriate? What are the requirements for new mechanical solutions, including product parameters?
The workshop covered four main areas of discussion:
The physical and environmental conditions in the present ROM building, and those proposed for the expanded and renovated museum
Sensitivities of museum artifacts to temperature, relative humidity, light, dust, and pollutants
The form of display units, such as cases and period names which are to enclose micro climates. They were examined with respect to the needs of the artifacts from the viewpoint of designers, curators, and conservators
The nature and use of micro climates themselves. They were discussed in terms of energy savings, the appropriateness of their use to the ROM’s collections and environmental conditions, the advisability of using sealed or “leaking” cases, construction materials, and lighting methods
General This specification describes the performance criteria for a family of temperature and relative humidity conditioning equipment. The units are to be used with moderately well-sealed exhibition cases in three size ranges. The units will be designed to fit within a space below the exhibition case and will be capable of being powered by standard electrical inputs and will interface with the case in an unobstructed manner.
Scope This specification is intended as a means of defining the required micro climate end products necessary for the conservation of certain objects. These end results are capable of being produced by a variety of mechanical, electrical and chemical techniques. The specification makes no attempt to fix those techniques applicable to each micro climate.
Classification The units shall be classified into two types and will be provided in three size configurations.
Type A Humidifiers Units in this category shall be capable of increasing the relative humidity (RH) within the conditioned space. They shall also have the ability to heat or cool air to maintain a fixed temperature-humidity condition.
Type B Dehumidifier Units in this category shall be capable of decreasing the RH within the condition space. They shall also have the ability to heat or cool air to maintain a fixed temperature-humidity condition.
Type C Dehumidifier Units in this category shall be capable of decreasing the RH within the conditioned space. They shall also have the ability to heat or cool air to maintain a fixed temperature-humidity condition.
Load Range Type A or B Units A1-A3: Humidifier for space of 10-1000 cubic feet B1-B3: Dehumidifier for space of 10-1000 cubic feet
Applicable Specifications Shall comply with national and regional electrical code requirements.
Output Characteristics Relative Humidity All type A units (humidifiers) shall be capable of producing a constant RH within the conditioned space of 50% -/+ 2%. This output shall be maintained within the all range of all input conditions. All type B units (dehumidifiers) shall be capable of producing a constant RH within the conditioned space of 20% -/+ 2%. This output shall be maintained within the full range of all input conditions.
Temperature: Type A or B Units Both type A and B units of all sizes shall be capable of maintaining the conditioned space at a temperature between 21ºC and 23.5º C (70ºC and 76º F -/+2ºF).
Temperature: Type C Units Type C units shall be capable of maintaining the conditioned space at a temperature of 4ºC +1º (40ºF +2º)
Make-Up Air Units of all types will supply air in quantities shown here (see airflow rates) in order to make up for air leakage from the cases. This make-up air shall be re-filtered for particulate matter to a level of 99% efficiency to 10 microns and 95% efficiency to 1 micron and for sulfur dioxide, ozone, and nitrous oxide by the use of charcoal or equivalent filtration.
Airflow Rates Type A1,2 and B1,2 units shall have the capability to supplying a minimum of 2.0-8.5 cubic feet per hour (CFH). Type A3 and B3 units shall have the capacity of supplying a minimum of 45 CFH.
Cooling and/or Heating Capacity Units shall have the capacity of modifying the case interior temperature to within the limits specified in the paragraph on Temperature: Type A or B Units. The unit shall be capable of cooling and/or heating the supply air to achieve this result. Heating or cooling loads will be dependent upon the process used for humidity control and for case surface heat load. A case surface heat load of 7 watts per square foot, from lighting shall be used for computations. Affected surface area for A1 and B1 units shall be considered to be 25 square feet; for A2 and B2 units the area shall be considered to be 50 square feet; for A3 and B3 units the area shall be considered to be 125 square feet.
Sound Level The equipment for the micro climate units shall operate at a sound level not exceeding NC-35 of the noise criteria curves recommended by the American Society of Hearing, Refrigerating and Air Conditioning engineers. This criterion may be exceeded during hours when the Museum is not open to the public if significant savings in efficiency, cost or ease of operations can be realized.
Vibration The equipment for the micro climate units shall be designed and isolated such that the transmitted vibration from the equipment to the exhibition case and the exhibits shall be negligible.
Input Characteristics All micro climate units will be subject to the following conditions.
Environmental Conditions Temperature and Humidity Air temperature surrounding the exterior of the exhibition cases and air available for make-up shall be provided at a temperature between 21º and 23.5ºC (70º and 75ºF -/+2%) and at a relative humidity ranging from 25% to 50% -/+ 10%.
Air Quality The surrounding ambient (building) air shall be filtered for particulate matter to 99% to 10 microns and 90% to 95% to 1 micron. It shall also have been passed through a charcoal or equivalent filter to remove SO2, O3 and NOx
Electrical Each unit shall be capable of operation when supplied with electrical power with the following characteristics: 120 VAC, 1 phase, 60 Hz, 15 Amperes.
Other Specific designs may require input water lines, drain or exhaust ports. Each of these , if required, shall be coordinated with the proper Museum personnel for size, location and availability.
Physical Considerations Size and Weight The equipment to be utilized in the micro climate controllers shall fit within a space to be provided below the exhibition case and shall not exceed 4 cubic feet in volume for size 1 and 2 units, and 8 cubic feet in volume for size 3 units, exclusive of storage containers (such as water tanks) which may be required. Available space for storage containers shall be identified by and coordinated with Museum personnel where such containers are necessary for a specific design. Wherever possible designs should limit equipment weight such that installation and removal may be easily accomplished without the need for special lifting or handling equipment.
Materials and Workmanship Materials selected for use in the units shall be such that they do not introduce contaminants into the micro climate. Materials shall also be selected for minimal maintenance and a long life. Workmanship shall be provided on a level to best commercial quality.
Life, Reliable and Maintainability Each micro climate unit shall be designed and constructed such that it will be capable of 24-hour-per-day, 365-day-per-year operation with a minimum of repairs, replacements or downtime. A design goal for equipment life should be such that a minimum of five years of operation be attained without major overhaul or replacement of any major components. Redundant components will be necessary to achieve the required life of reliable, trouble free equipment.
Museum maintenance must be considered when designing the unit for access doors, plug-in modules, quick connect circuits, and similar techniques for improving maintainability and shall be provided wherever applicable.
Instrumentation and Controls Controls Each unit shall have, as a minimum, a switch for energizing the equipment, a light indicating that the equipment has been energized, and a setting for the control of relative humidity. Humidifiers (type A) shall be adjustable from 30% to 70% RH. Dehumidifiers shall be adjustable from 5% to 40% RH. Controls shall be easily accessible to operating personnel but shall be protected from inadvertent disturbance.
Instrumentation Each micro climate unit shall be provided with a signal device such as an indicating light which will signal an out-of-tolerance condition. This light shall be visible on the exterior of the exhibition case so that a guard or personnel assigned to micro climate checking may see the signal readily. In addition, the specific out-of-tolerance condition, (ex. high humidity, low humidity, high temperature) shall be indicated on the equipment control panel and shall be visible when the unit is checked at the exhibition case. In addition, the units shall be equipped with plug-in read-out ports such that the actual RH and temperature may be indicated or recorded near the exhibition case by plugging in a specific indicator or recorder for relative humidity or temperature. The selection of type of instrumentation shall be coordinated with cognisant Museum personnel. The intention is to have each micro climate controlled case equipped with the ability for read-out (sensors) and to have several portable read-out devices, both indicating and recording types which will be utilized on specific cases as deemed necessary.
The relative humidity of the air is the RATIO of the actual amount of moisture in a volume of air versus the saturated amount of moisture in that volume.
Expressing this in more detail, we can say that relative humidity, RH, is a measurement expressed as a percentage of the moisture content relative to the amount of water, which that body of air could hold, if saturated at the same temperature and pressure.
Most substances contain a certain quantity of water, which is determined by the relative humidity of the surrounding air, or ambient conditions. For any given RH condition, a substance has precise and specific moisture content when it is in equilibrium with the surrounding air. This equilibrium moisture content (EMC) of any material is the ratio of the water it contains to the dry mass of the material expressed as a percentage. For each RH condition, a given material has corresponding equilibrium moisture content. This can be represented by an ECM curve.
To protect the artifact, the equilibrium moisture content must be kept constant. This requires both stable temperature and relative humidity levels.
When at equilibrium, the differential vapour pressure of the moisture content in the artifact and the relative humidity of the surrounding air is ZERO, meaning that the water molecules are not moving from the artifact to the surrounding air, or vice versa. It is vapour pressure that is the driving force to move water molecules one way or the other.
The most common damaging effects of a continuous change of moisture content in an artifact are:
Cracking or splitting of wooden objects
Flaking of coatings (such as paint) on coated objects
Mold developing on certain organic objects
Efflorescence of pottery
Corrosion of metal objects
To protect from any of these possible environmental damages, in addition to preventing people from touching or handling the artifact, it can be encapsulated in a sealed enclosure thus creating a Micro Climate.
What is a Micro Climate?
A micro climate is generally the condition inside an enclosed space, insofar as it differs in temperature, humidity and air cleanliness from the surrounding ambient. With regards to humidity, the required parameters for a museum display case are a constant, non-cycling level of relative humidity that is maintained within the conservator’s set parameters.
In the past, it was difficult for the conservator, or curator, to establish the proper stable environment that is required for certain artifacts, since the choices were very limited.
Today, a large amount of literature is available, as well as new technologies, aiding in the decision. Each artifact has to be judged for its sensitivity to temperature, relative humidity, light, and dust (pollutants). Once it has been decided that humidity controls are essential for the preservation of the artifact, a decision has to be made as to how it can be accomplished.
How to Accomplish Relative Humidity Control
There are basically three choices from which to select:
A) Whole Building HVAC System
B) Passive System
C) Active System
A) The HVAC System
Using the Building HVAC System, artifacts inside of an enclosure are subjected to the same conditions as the ambient. Basically, this subjects the artifacts to the same temperature and humidity conditions as the building environment.
The building HVAC system is usually only designed for human comfort. In the winter, you have to heat and humidify, while in the summer one has to cool and de-humidify. In the fall and spring, these variable conditions can all occur in a single day, making it extremely difficult for the system to respond quickly. In addition, especially during this energy crunch, building maintenance likes to reduce the temperature of the building during the night to save money. This may cause additional stress to the artifacts.
Other factors that can affect the ambient conditions in the building are:
open doors or windows
extremely fast load changes caused by large numbers of visitors (especially on a rainy day)
rapid environmental changes, especially in the transfer seasons of spring and fall
To maintain an even temperature and RH, elaborate controls and equipment are required. These systems are slow to respond, especially in the spring and fall, when rapid ambient temperature and humidity changes occur.
For existing older buildings, it can be very expensive in capital and operating cost, to try to maintain stable temperature and humidity conditions. In most cases, major modifications to the existing building and HVAC systems will be required. For new buildings, the accuracy to protect the artifact (even at -/+ 2ºC and -/+ 3% RH) is extremely expensive, requiring leak proof ducts, top quality filtration, and elaborate up and down RH controls.
In summary: all artifacts in the enclosures will be at the same variable temperature and RH conditions as the ambient.
B) Passive Systems
A passive system, otherwise called a desiccant system, basically utilizes silica gel or a similar medium as a buffer material. Silica gel has been utilized since the 1950s for this purpose. The medium is conditioned, or regenerated, to produce the required humidity inside of an enclosure. No mechanical air movement is employed, so this is effectively a static system.
For the silica gel buffer to be effective, it has to meet the following requirements:
Have a high capacity either to release or to absorb water (such gels will have a relatively high moisture content around the desired RH level. That is, the EMC vs. RH curve will have a steep linear slope near the desired RH so that large EMC changes correspond to lesser RH changes).
Must offer a large surface area to allow a rapid rate of buffering.
Must not suffer any physical damage when it absorbs and desorbs water.
Must remain dry to the touch even with a high moisture content.
Must be able to condition and regenerate.
Must be re-usable.
When silica gel is employed for micro climate controls, the following decisions must be made:
the type of silica gel required for your particular application
the amount of silica gel required for a particular enclosure, rule of thumb is 20 kg/1m3 of display case volume
the methods of accurately conditioning silica gel
the type of well-sealed enclosure required to house the silica gel so that is can be removed and replaced when conditioning or regeneration is required
adequate apertures above the silica gel into the inside of the enclosure
providing a very well-sealed enclosure for the artifact contained inside of the case environment
The desiccant can be contained in cheese cloth bags or loosely placed in a removable tray. The surface of the gel has to be exposed to the interior of the enclosure, which will normally place the gel in the bottom of the display case enclosure.
The artifact has to be contained in an extremely well-sealed enclosure to minimize the effects of ambient humidity on the enclosure exhibit space. Furthermore, the enclosure needs to be designed or an existing case must be modified for the extra weight, volume, and accessibility to place and remove the silica gel. For long term stability and a minimum amount of maintenance (no more than twice a year), the enclosure should be opened rarely and the gel spread out in this layer for maximum exposure.
This system is very slow to respond to changes in ambient temperature.
In taller display cases, stratification (e.g. RH layering) can be a problem. In addition conditioning and regulating silica gel is labour intensive and requires specialized equipment.
In summary: Only artifacts in very small, very well sealed cases can be protected.
C) Active Systems
An active system uses an external electro /mechanical generator connected by hose(s) to an enclosure. The generator continuously supplies and monitors the required RH to the enclosure.
The active system of climate control, if designed properly, responds very quickly to changes in ambient temperature and relative humidity.
The artifact can be contained in a moderately well sealed enclosure. However, the sealing requirements are not nearly as stringent as those required for the passive system, if the system is designed with ample capacity.
In general, there are two types of active systems available:
A small unit for individual display case(s) to a total volume of 8m³. This unit is most often located in the bottom of the display case, and connected to the upper display space by small hoses. A sensor inside the display space case continuously monitors the required RH. The enclosure needs to be designed or modified for placement of the climate controller and/or air supply hoses. The individual micro climate generator requires a 120 VAC outlet as well as adequate ventilation.
A large unit for an entire gallery of display cases, period rooms or storage space up to a total volume of 200m³. This unit is most often located in a mechanical room, or a large closet, where the required utilities are present (i.e. water supply, 240 volt hook –up and floor drain). A network of small air supply piping connects the large unit to each individual display case. This unit will fully compensate for the temperature fluctuations in the gallery.
The capacity of both the small and large active systems are very much dependant on the construction of the display volume (e.g. display case). Much has been written about “well-sealed” display cases. What is the definition of a “well-sealed” display case, and can leakage rate be measured? A leakage rate of 10% or less of a case volume over a 24 hour period is attainable in new display cases only, and only in small display cases ( i.e. 5m³ or less). These cases are often very expensive and allow for very little access or movement. More realistic for the majority of existing display cases is a leakage rate of two to four case volumes over a 24 hour period.
To make an educated decision regarding method of controlling the enclosure, as well as the capacity required, the leakage rate (commonly referred to as air exchange rate (AER) should be established. In addition a choice should be made if the conditioned air from the Micro Climate unit should be recirculating or positive pressure.
The recirculating type unit continuously removes a fixed quantity of air from the display volume conditions the air and returns the same air back to the display case. Micro Climate Generators adopting this type of system generally have a much larger air capacity and require much less water supply, less water drainage and overall much less maintenance.
The positive pressure type unit takes a very small quantity of gallery (ambient) air and conditions this air as required and deliveries it to the display case. The air will pressurize the case and exits from the case though the leaks (or intentional exhaust opening) form the display case. These types of units have a very small capacity and are high maintenance for water supply, water drainage and air filtration.
An excellent article titled: “Simple methods to measure air exchange rates and detect leaks in display and storage enclosures” written by Andrew Calver and Andy Holbrook and co-authored by David Thickett and Steven Wintraub, can be found at www.cwaller.de/vitrinentest/calver2005_air_echange.pdf
In its conclusion the authors state:
“We have shown that the AER of enclosures, an important factor for preventive conservation, can be easily calculated using low cost gas detectors. “
More and more case manufacturers are starting to use test methods to comply with the required specifications.
An overview is attached comparing the three most popular small micro climate generators, which are available at present.
1.CONDITIONING SILICA GEL OUTSIDE THE EXHIBIT CASE REMOVING MOISTURE The most efficient method of removing moisture is with heat. Although silica gel has a very high melting temperature (1600º C), it will lose its chemically bound water and hygroscopic properties if heated above 300º C. In addition, there is a new class of indicator gels, incorporating organic dyes that are heat sensitive and their color indicating dye will be effected above 125-150º C (Goldberg and Weintraub 2001). Therefore, it is not recommended that indicating silica gel be heated above 120º C and regular gel be heated above 200º C. The principle impact of a lower heat of regeneration is that a longer time is required to dry the gel and there is less potential for the degradation of silica gel properties. In a conventional oven, the time of regeneration varies from minutes to hours, depending on temperature and the thickness of the gel. Although silica gel can be dried in a microwave oven, it is difficult to determine the temperature inside the gel. Also, since metal cannot be used in a microwave oven, only glass, ceramic or microwave safe plastic with a high melting temperature should be used to hold the gel, since the individual beads can become very hot. ADDING MOISTURE The simplest method for conditioning silica gel is to place it in a room or environmental chamber set to the desired RH level. The best method of confirming that the silica gel is at the correct RH is by measuring the RH of a sample batch of gel. This is done by placing the sample gel in a sealed container or plastic bag with a hygrometer (use a large amount of gel relative to the surrounding air), and allow a day for the RH within the bag to stabilize with the gel mixture. Although an approximate RH value can be calculated based on weight, this method is not recommended because of its margin of error. • Methods of speeding up conditioning time: o Spread the gel as thin as possible. o Use a fan to circulate air around the gel. o Periodically mix the gel layers to improve uniformity. • For a single layer of bead, allow at least 4 days if the gel is initially dry, and longer if spread as a thicker layer. • Silica gel can be conditioned to a higher RH than the desired level, either to speed up the conditioning process or because of the inability to control RH. If so, it is important to allow 2-3 day for the moisture to equilibrate within and between the gel beads, especially if beads with different moisture contents are mixed together. • The direct addition of water through mist spraying or immersion is not recommended, since the high heat of decrepitation causes silica gel beads to crack and fragment. Although silica gel retains its hygroscopic properties, the overall response time of silica gel in a tray will slow down because of denser packing from the mix of large beads and smaller fragments.
2. METHODS FOR CONDITIONING SILICA GEL WITHOUT REMOVING IT FROM THE EXHIBIT CASE Silica gel in cases can be reconditioned by adding water or appropriately conditioned silica gel to the case. This method is very effective if the silica gel is spread into a very thin layer, or has a very fast response time, such as is achieved with Rhapid Gel. Otherwise, only the upper layer of silica gel will be conditioned and there is a risk that the RH within the case will rise or fall too quickly, without adequately conditioning the full bulk of silica gel. Increasing or decreasing surface area can control the rate of water evaporation. If there is concern about placing water directly in a case, or if a fast rate of evaporation is desired, a saturated humidifier wicking pad, preferably one treated with an antimicrobial agent, can be used. Generally, water will evaporate more rapidly in this manner because of the extended surface area of the wicking pad compared to a dish of water. The initial speed at which dry gel removes excess moisture is very fast. It is important to limit the surface area of dry gel to prevent the case RH from dropping too quickly. This is because the speed at which dry gel adsorbs moisture is faster than the rate at which silica gel desorbs moisture. If silica gel is conditioned in place, the rate at which the RH rises or falls within the case must be carefully monitored in order to determine if the rate is acceptable and when the water or dry gel that was placed in the case to condition the main supply of silica gel must be removed. It is possible to calculate how much moisture must be added or removed to recondition silica gel in place (Lafontaine 1984, Weintraub 1991). It is important to take into account the impact of other hygroscopic materials inside the case. With experience, adjusting the amount of water or dry gel required may be required to compensate for other hygroscopic materials.
CALCULATE THE AMOUNT OF WATER REQUIRED TO INCREASE RH: Multiply the % increase in RH required, the MH value of the silica gel, and the weight of silica gel within the case. For example, if the goal is to raise RH from 45% to 55% in a case containing 2 kilograms of silica gel with an MH of 9, 180 grams of water is required: 10% RH x 9 (MH) x 2 kg = 180 grams of water
CALCULATE THE AMOUNT OF DRY SILICA GEL REQUIRED TO DECREASE RH: • Step 1 – Determine how much moisture must be removed by multiplying the % decrease in RH required by the MH value of the silica and the total amount of silica gel within the case. • Step 2 – Establish the EMC adsorption value for the dry gel at the desired RH setpoint and multiply this value by 10, to convert the value to the amount of moisture that can be removed per kilogram of dry gel. • Step 3 – Divide the amount of water to be removed (Step 1) by the amount of water that can be removed by a kilogram of dry gel (Step 2). The result is the total amount required to recondition the silica gel in place. For example, the goal is to lower RH from 55% to 45% in a case containing 2 kilograms of Rhapid Gel (MH = 9). If the dry gel is a regular density silica gel (EMC = 25% at 45% RH), the amount of dry gel required is 0.72 kilograms: 1) 10% RH x 9 (MH) x 2 kg = 180 grams of water 2) 25% EMC x 10 = 250 g of moisture per kg of silica gel at 45% RH 3) 180g/250 g = 0.72 kilograms AUTHOR’S ADDRESS Steven Weintraub, Art Preservation Services, 315 East 89 Street, New York City, NY, 10128 (sw@apsnyc.org). Extract from an article published in: Object Specialty Group Postprints (vol. 9), 2002. Washington, D.C.: American Institute for Conservation
Museum collections are one of a kind and contain some of the most cherished and valuable treasures around the world. It is apparent that these collections must be kept under the safest, most stable and well controlled environmental conditions possible in order to preserve them. The best conditions for an artifact are a stable temperature, safe light levels and, the hardest condition to control, a stable relative humidity (RH). There are a couple ways to regulate relative humidity, but using silica gel is the most widely encountered and well known methods out there.
Silica gel is an inert, porous, non-crystalline, granular form of silica, comprised of silicon and oxygen. The gel has a high absorptive capacity for water vapor, making it a good buffering agent, absorbing not only water, but some airborne pollutants as well. Silica gel is good to use, as it is non-deliquescent, non-corrosive, stable, and compatible with most other materials. Silica gel can be used both as a drying agent and as a moisture releasing agent, to removing moisture from the air as the former and adding moisture to the air as the latter. For both of these purposes, silica gel must be conditioned before its insertion into a display case. The processes of preparation, conditioning and maintenance are very import and is vital that museum staff know how to properly carry out these procedures.
Silica gel can be kept for a long time without fear of exceeding its life span in which it can still be used. This being said, purchasing a large supply and then storing some for later use can be a good idea. There are many different grades of silica gel that can be used in display cases without a problem. The rates of absorption and desorption only vary slightly for the different grades, the rate differences are so slight that it is not significant for most gels.
Some types are indicating silica gels, and are coated in cobalt salts which change the colour of the gel according to its moisture content. These types of silica gel are blue when dry and become pink when saturated. Although the gel is non-toxic, it does give off a fine silica dust when being moved from one container to the next which can be harmful and cause irritations. In order to minimize the risks when handling silica gel, dust-filtering masks and gloves should be worn.
As a humidity buffer, dry silica gel can reduce humidity fro m an humid enclosure by exposing it for a certain amount of time and vice versa for drier enclosures. For any given RH, silica gel has a corresponding moisture con tent when it is in equilibrium with the atmosphere around it. The equilibrium moisture content (EMC) of a substance is the ratio between the mass of water that the substance contains versus its dry mass, shown as a percentage. Silica gel is a good humidity buffer because of its large amount surface area, allowing the gel to have a rapid rate of buffering; its high capacity for absorbing and releasing water; its resilience to physical damage as it absorbs and releases water; the gel is still dry to the touch even if it has a high moisture content; and the gel is reusable and easily conditioned.
Silica gel is a great buffer, because it can be reused many many times after it is first purchased and used. Before each use however, it must be reconditioned to meet the moisture content requirements of the case it is buffering. There are a couple different ways to condition silica gel, and a few of them will be described. When conditioning the silica gel, you must ensure that the moisture content of the gel is the same as the EMC at the specified RH you are using it for. This value is determined by using the EMC vs. RH curve for the specific gel that you are using.
Conditioning Silica Gel
There are four main steps to go through when conditioning the gel: drying the gel, determining the amount required for the case it is buffering, weighing out the gel, and adding moisture to the silica gel.
To begin conditioning the gel, you must first make sure that it is completely dry in order to weigh it and obtain the dry mass of the silica gel. To dry the silica gel, spread it in shallow pans and heat it at 120ºC for a minimum of 12 hours. After the gel has been heated, place it in metal containers immediately and seal it tightly to ensure that it will remain dry. Weigh the amount gel after it has cooled.
The next step is to figure out the amount of gel you need, to make sure that you do not have too much or too little. Too much silica gel would require an excessive amount of space needed to house it, and add additional costs when designing and building the case. Too little will not have the needed capacity to buffer the enclosure on a long-term basis with a fluctuating RH. The general rule of thumb for a well sealed case, is to use 20 kg of conditioned silica gel for every cubic meter of volume in the display case. Following this recommendation, the case can be kept in a 35% to 65% RH range using silica gel. To determine the amount of conditioned gel that is required, multiply the case volume by 20. After you have done that, you can figure out the corresponding EMC of the specific gel you are using at whichever RH the silica gel will be used to maintain (using the EMC vs. RH graph). With these pieces of information you can figure out the mass of dry silica gel you need by using this formula:
Once you have this information, the volume of the required silica gel can be determined by using this formula:
Now the silica gel can be weighed out to the specific amount that is needed for conditioning. To condition the gel, either permeable, heat-resistant bags or screen-trays can be used to hold the silica gel. Using bags to condition the gel is easier for handling and reusing the gel, since you can condition the silica gel in the bags and just insert the same bags into the enclosure it is buffering.
Before putting the gel into its container, weigh the empty container first, record the mass and then pour the dried silica gel into it. Label the the container with the dry mass. If you are using bags, stitch the bag closed first, then label the bag with the dry mass.
The last conditioning step is to add the right amount of moisture to the silica gel until the gel reaches the required moisture content. There are a couple of different ways to add moisture to the gel. The normal way is to set the RH of the conditioning chamber to the RH of the constant environment it will be buffering (ex. if the gel is being used to buffer an environment at 50%, set the conditioning chamber to 50% RH). Then thinly spread the silica gel into the chamber and leave it in, checking it periodically until the mass of the gel stops changing. Depending on how thick the layer of gel is, the amount of stirring that is done, and the screen-mesh size of the pan, the time it takes to condition the gel will vary. This process should take about 2-3 weeks, but using a fan can help to speed up the process.
There are rapid conditioning techniques that can take up to 2-3 days, instead of 2-3 weeks. One way is to place the silica gel into a moisture sealed container and run a humidifier on full capacity. This will create an environment with a 95% RH and the silica gel should absorb the moisture readily. A problem with doing this is overshooting the needed EMC, adding too much moisture. Another way to quickly add moisture to the silica gel would be to spray it with water. Doing this however, is not very accurate as it would be easy to over spray the top layer and under spray the concealed bottom layer. Decrepitation would also become a risk, as adding too much water would cause the gel crystals to breakdown and crack.
To make sure the conditioning has been carried out properly, taking samples of the silica gel and measuring the EMC is important to ensure that it has the cor
rect moisture content. To measure the EMC, there are instruments available that can give out direct readings, but there are ways to figure it out without these instruments. To calculate the EMC, first you need to heat up a hot plate until it reaches 250ºC, taking around 30 minutes. Put 20-30g of conditioned silica gel into a polyethylene bag and record the time the gel was taken out of the chamber and what conditions have been used to condition the gel. To ensure an accurate reading, prepare 2 samples at once. Pre-weigh 2 pans, record the weight and then put a 10g sample of silica gel into each of the pans. Label and re-weigh each pan. After you have done this, place the pans on the hot plate and weigh them at 10 minute intervals until the pans both stop changing their masses. Weigh the final mass. After gathering these pieces of information, it is possible to calculate the EMC, using this formula:
Wi= weight of condition gel & pan Wf= heated gel & pan Wp= empty pan weight
After ensuring that the moisture content is correct, the silica gel is ready to be used and can be placed into the display case that it is buffering. When the micro climate indicates that the RH has changed more than it should have, then check the silica gel using the same method described above to find out the EMC and to recondition it. The silica gel should not need to be replaced more than twice a year, and if it is more than that, then a re-examination of the display case is needed to make sure it is well sealed. An examination of the disposition and quantity of the gel is also suggested if it has to be replaced frequently.
Works Cited
Canada. Canadian Conservation Institute. Environment and Deterioration Research Division. Silica Gel. By Raymond H. Lafontaine. Vol. 10. Ottawa, Canada: Canadian Conservation Institute, 1984. Print.
Stolow, Nathan. “Silica Gel and Related RH Buffering Materials, Conditioning and Regeneration Techniques.” Care of Collections. By Simon J. Knell. London: Routledge, 1994. 93-100. Print.